
Carbon Dioxide or Solar Forcing?
By: Nir J. Shaviv
Natural or Anthropogenic? Which mechanism is responsible for global warming over the 20th century?
According to the common perception, the temperature over the 20th century has been warming, and it is mostly anthropogenic in origin, with greenhouse gases (GHGs) being the dominant driver. Others, usually called "skeptics", challenge this view and instead claim that the temperature variations are all part of natural variability. As I try to demonstrate below, the truth is probably somewhere in between, with natural causes probably being more important over the past century, whereas anthropogenic causes will probably be more dominant over the next century. Following empirical evidence I describe below, about 2/3's (give or take a third or so) of the warming should be attributed to increased solar activity and the remaining to anthropogenic causes.
Like many others, I was personally sure that CO2 is the bad culprit in the story of global warming. But after carefully digging into the evidence, I realized that things are far more complicated than the story sold to us by many climate scientists or the stories regurgitated by the media. In fact, there is much more than meets the eye.
The truth is that there is no real evidence for this link. Most of the "evidence" often mentioned in the media, is evidence for global warming (e.g., melting of arctic ice-sheets). But who said that this warming (which indeed took place over the 20th century) is because of GHGs? In fact, there is no substantial evidence which proves that CO2 and other GHGs are the primary cause for the warming, and not some other mechanism. You may have seen articles which point to the contrary, that there is clear evidence, but if you dig deeply into them, you will realize that these are merely suggestions for a CO2 climate link and not evidence.
The IPCC writes about fingerprinting the anthropogenic causes. In particular, their report states that (IPCC TAR §12.2.3):
Hence, using models to find fingerprints is hard. If you read the TAR (in particular, chapter 12), you will find claims that the different warming in northern vs. southern latitudes, and tropospheric vs. stratospheric warming can be explained using anthropogenic GHGs operating together with sulphate aerosols, stratospheric ozone and even solar (total irradiance) forcing. Namely, the combination of the drivers can do a descent job in explaining the warming (IPCC TAR §12.4.3.2):
But in itself it is not proof that GHGs are the major cause. These consistent results only indicate that CO2 can explain the warming, not that it is the only possible explanation. Without other "suspects", it would be incriminating circumstantial evidence. However another very good candidate to explain a large fraction of the warming does exist, as I explain below.
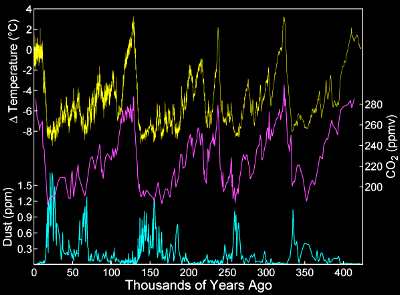 Of course, the beautiful correlation between CO2 reconstructions
and temperature on Earth over the multi-millennial time scale, as it apparent in the figure, is often used to demonstrate how CO2 plays a role in large climate variations. This often misleads the laymen to believe that CO2 is the climate driver, whereas in fact it could be the opposite, that the global temperature affects the equilibrium levels of CO2. In reality it could be somewhere in between, that CO2 is affected by the temperature and that it in turn causes a larger temperature variation. Just by itself, however, this correlation cannot be used to quantify the effect of CO2 on the climate, which could be anywhere from no effect to all the effect. Thus, it is no proof that CO2 is the main cause of the variations over the 20th century. There is no such evidence.
Of course, the beautiful correlation between CO2 reconstructions
and temperature on Earth over the multi-millennial time scale, as it apparent in the figure, is often used to demonstrate how CO2 plays a role in large climate variations. This often misleads the laymen to believe that CO2 is the climate driver, whereas in fact it could be the opposite, that the global temperature affects the equilibrium levels of CO2. In reality it could be somewhere in between, that CO2 is affected by the temperature and that it in turn causes a larger temperature variation. Just by itself, however, this correlation cannot be used to quantify the effect of CO2 on the climate, which could be anywhere from no effect to all the effect. Thus, it is no proof that CO2 is the main cause of the variations over the 20th century. There is no such evidence.
As far as I see it, there are two main reasons why GHGs are blamed as the main cause of global warming even through there is no real incriminating evidence:
As to the second point, there is another good mechanism to blame, that of indirect solar forcing. This mechanism can do just as good a job in explaining 20th century warming as CO2, if not a better one.
On average, every square meter of the global surface receives a flux about 240 Watts per square meter. Of course, equatorial surfaces receive more than polar regions, which is why this figure for the radiative flux is an average.
The climatic effect of different global processes is usually quantified with their contribution to a net change in the average radiative flux. For example, doubling the amount of CO2 in the atmosphere changes the radiative budget by about 4 W/m² (3.8 W/m² to be more exact), as if the sun was 4/240*100=1.7% brighter.
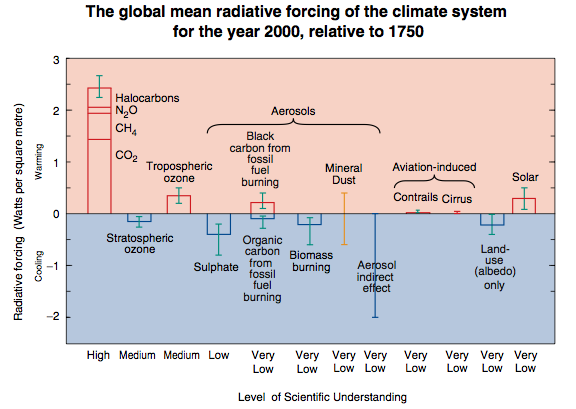
The scientific report of the Intergovernmental panel for climate change (IPCC) attempts to summarize the effects of all the drivers. This is displayed in the famous forcing graph below. There are several interesting points one should note. First, there is a large uncertainty in an anthropogenic contribution called the indirect aerosol effect. This effect arises from the fact that increased amounts of small particles in the atmosphere will alter the characteristics of clouds. This is best seen downstream of chimney stacks or in marine clouds in the form of ship tracks. Since cloud formation, and in particular, the characteristics of clouds, is not well understood, the indirect aerosol effect is highly uncertain. The second point to note is that the solar forcing quoted by the IPCC is 0.3 W/m². This does not include the effect of the solar modulated cosmic ray flux, which has ample evidence to support it, and no real evidence to refute it. If one includes the effects of cosmic rays, an additional 1 W/m² should be added because of the increased solar activity (which reduced the flux of cosmic rays reaching Earth, as will be explained below).
 Evidently, we do not know the total Anthropogenic forcing. We don't know
its sign. We also don't know its magnitude. All we can say is that it
should be somewhere between -1 to +2 W/m². Sounds strange, but we may
have actually been cooling Earth (though less likely than warming). It is
for this reason that in the 1970's, concerns were raised that humanity is cooling the global temperature. The global temperature appeared to drop between the 1940's and
1970's, and some thought that anthropogenic aerosols could be the cause of
the observed global cooling, and that we may be triggering a new ice-age (e.g., see wikiepdia for a summary)
Evidently, we do not know the total Anthropogenic forcing. We don't know
its sign. We also don't know its magnitude. All we can say is that it
should be somewhere between -1 to +2 W/m². Sounds strange, but we may
have actually been cooling Earth (though less likely than warming). It is
for this reason that in the 1970's, concerns were raised that humanity is cooling the global temperature. The global temperature appeared to drop between the 1940's and
1970's, and some thought that anthropogenic aerosols could be the cause of
the observed global cooling, and that we may be triggering a new ice-age (e.g., see wikiepdia for a summary)
The problem with numerical simulations of climate is that the feedbacks, especially those pertaining to cloud cover, are very poorly understood. As a result, any value in the range of Tx2≈1.5-4.5°C is believed to be possible according to the IPCC. In other words, based on theory (well, numerical simulations to be more exact), the temperature change associated with doubled CO2 is not known to within a factor of 3!
Clearly, the incrimination of CO2 (and other GHGs) is primarily because we expect it to warm (see fig. 4), and we do see warming (see fig. 3), but it turns out that there are other suspects.
Because the solar correlated climate variations are large, but the total solar irradiance variations are relatively small (a few 0.1%), the latter are most likely not the explanation of climate variability. Instead, different amplifying mechanisms were suggested, mechanisms which can amplify the non-thermal components of the sun (e.g., UV, X-ray, solar wind) and which can considerably vary between an active sun and a quiet one.
The leading mechanism to explain the large solar induced climate variability is through solar wind modulation of the cosmic ray flux reaching the Earth, which affects climate through modulation of the amount of atmospheric ionization. Over the past decade, many different pieces of evidence added up to a pretty coherent picture.
The activity of the sun manifests its self in many ways. One of them is through a variable solar wind. This flux of energetic particles and entangled magnetic field flows outwards from the sun, and impedes on a flux of more energetic particles, the cosmic rays, which come from outside the solar system. Namely, a more active sun with a stronger solar wind will attenuate the flux of cosmic rays reaching Earth. The key point in this picture is that the cosmic rays are the main physical mechanism controlling the amount of ionization in the troposphere (the bottom 10 kms or so). Thus, a more active sun will reduce the flux of cosmic rays, and with it, the amount of tropospheric ionization. As it turns out, this amount of ionization affects the formation of condensation nuclei required for the formation of clouds in clean marine environment. A more active sun will therefore inhibit the formation of cloud condensation nuclei, and the resulting low altitude marine clouds will have larger drops, which are less white and live shorter, thereby warming Earth.
Today, there is ample evidence to support this picture (a succinct introduction can be found here). For example, it was found that independent galactic induced variations in the cosmic ray flux, which have nothing to do with solar activity do too affect climate as one should expect from such a link. There are many more examples. [Added Note (4 Oct. 2006): These recently published experimental results stroingly point towards the validity of this link, as expected]
So why is this link important for global warming? As previously mentioned, solar activity has been increasing over the 20th century. This can be seen in fig. 5. Thus, we expect warming from the reduced flux of cosmic rays. Moreover, since the cosmic ray flux actually had a small increase between the 1940's and 1970's (as can be seen in the ion chamber data in fig. 6), this mechanism also naturally explains the global temperature decrease which took place during the same period.
Using historic variations in climate and the cosmic ray flux, one can actually quantify empirically the relation between cosmic ray flux variations and global temperature change, and estimate the solar contribution to the 20th century warming. This contribution comes out to be 0.5±0.2°C out of the observed 0.6±0.2°C global warming (Shaviv, 2005).
Although this reasoning seems logical, it turns out that (1) We don't even know the sign of the anthropogenic climate driving (because of the unknown indirect aerosol effects), and (2) There is an alternative mechanism which can explain a large part of the warming.
Solar activity can explain a large part of the 20th century global warming, on condition that there is a strong solar/climate link through modulation of the cosmic ray flux and the atmospheric ionization. Evidence for such a link has been accumulating over the past decade, and by now, it is unlikely that it does not exist.
This link also implies that Earth's global temperature sensitivity is also on the low side. Thus, if we double the amount of CO2 by 2100, we will only increase the temperature by about 1°C or so. This is still more than the change over the past century. This is good news, because it implies that future increases in the amount of atmospheric greenhouse gases will not dramatically increase the global temperature, though GHGs will probably be the dominate climate driver.
The two primary reasons why fossil fuels are bad are of course pollution and depletion, while minor reasons include for example the fact that many fossil fuel reserves are controlled by unpleasant governments.
Thus, I am very much in favor, and always have been, in using less fossil fuels and keeping the environment clean (I am proud to say that I grew up in a solar house), but we should do things for the right reasons, not the wrong ones (and I don't see Kyoto addressing the right reasons). I am therefore in favor of developing cheap alternatives such as solar power, wind, and of course fusion reactors (converting Deuterium into Helium) which we should have in a few decades, but this is an altogether different issue.
Natural or Anthropogenic? Which mechanism is responsible for global warming over the 20th century?
According to the common perception, the temperature over the 20th century has been warming, and it is mostly anthropogenic in origin, with greenhouse gases (GHGs) being the dominant driver. Others, usually called "skeptics", challenge this view and instead claim that the temperature variations are all part of natural variability. As I try to demonstrate below, the truth is probably somewhere in between, with natural causes probably being more important over the past century, whereas anthropogenic causes will probably be more dominant over the next century. Following empirical evidence I describe below, about 2/3's (give or take a third or so) of the warming should be attributed to increased solar activity and the remaining to anthropogenic causes.
Like many others, I was personally sure that CO2 is the bad culprit in the story of global warming. But after carefully digging into the evidence, I realized that things are far more complicated than the story sold to us by many climate scientists or the stories regurgitated by the media. In fact, there is much more than meets the eye.
What is the evidence for an anthropogenic effect?
The first question we wish to address is whether there is actual evidence indicating that greenhouse gases (GHGs) are responsible for most of the warming. Basically, we observe a temperature rise over the 20th century, and we measure a rise in the global concentration of CO2 and other anthropogenic greenhouse gases. What is the evidence proving that the increase in the GHGs is the cause for the temperature increase?The truth is that there is no real evidence for this link. Most of the "evidence" often mentioned in the media, is evidence for global warming (e.g., melting of arctic ice-sheets). But who said that this warming (which indeed took place over the 20th century) is because of GHGs? In fact, there is no substantial evidence which proves that CO2 and other GHGs are the primary cause for the warming, and not some other mechanism. You may have seen articles which point to the contrary, that there is clear evidence, but if you dig deeply into them, you will realize that these are merely suggestions for a CO2 climate link and not evidence.
The IPCC writes about fingerprinting the anthropogenic causes. In particular, their report states that (IPCC TAR §12.2.3):
“Different models may give quite different patterns of response for the same forcing, but an individual model may give a surprisingly similar response for different forcings. The first point means that attribution studies may give different results when using signals generated from different models. The second point means that it may be more difficult to distinguish between the response to different factors than one might expect, given the differences in radiative forcing.”
Hence, using models to find fingerprints is hard. If you read the TAR (in particular, chapter 12), you will find claims that the different warming in northern vs. southern latitudes, and tropospheric vs. stratospheric warming can be explained using anthropogenic GHGs operating together with sulphate aerosols, stratospheric ozone and even solar (total irradiance) forcing. Namely, the combination of the drivers can do a descent job in explaining the warming (IPCC TAR §12.4.3.2):
“In summary, the fixed pattern studies indicate that the recent warming is unlikely (bordering on very unlikely) to be due to internal climate variability. A substantial response to anthropogenic greenhouse gases appears to be necessary to account for recent temperature trends but the majority of studies indicate that greenhouse gases alone do not appear to be able to provide a full explanation. Inclusion of the response to the direct effect of sulphate aerosols usually leads to a more satisfactory explanation of the observed changes, although the amplitude of the sulphate signal depends on the model used. These studies also provide some evidence that solar variations may have contributed to the early century warming.”
But in itself it is not proof that GHGs are the major cause. These consistent results only indicate that CO2 can explain the warming, not that it is the only possible explanation. Without other "suspects", it would be incriminating circumstantial evidence. However another very good candidate to explain a large fraction of the warming does exist, as I explain below.

Fig. 1: Correlation between atmospheric CO2 and climate. Nope, it is not proof that CO2 is a major climate driver, since CO2 can be driven by temperature changes. Specifically, warmer oceans requires larger atmospheric partial pressures of CO2 to contain the dissolved gas in them. Of course, some of the temperature could be the result of CO2 amplifications, but there is no way of knowing what fraction.
As far as I see it, there are two main reasons why GHGs are blamed as the main cause of global warming even through there is no real incriminating evidence:
- Based on theory, increased levels of GHGs are expected to increase the global temperature.
- There is no other mechanism to blame for the warming. Without any other candidate, the only suspect, i.e. GHGs, must be the cause.
As to the second point, there is another good mechanism to blame, that of indirect solar forcing. This mechanism can do just as good a job in explaining 20th century warming as CO2, if not a better one.
The anthropogenic driving - How much is it?
If we wish to assess theoretically, how much is the anthropogenic contribution to 20th century warming, we have to address two questions, how much is the anthropogenic contribution to the changed radiation budget, and how changes in the radiation budget affect the global temperature. We begin with the anthropogenic contribution.On average, every square meter of the global surface receives a flux about 240 Watts per square meter. Of course, equatorial surfaces receive more than polar regions, which is why this figure for the radiative flux is an average.
The climatic effect of different global processes is usually quantified with their contribution to a net change in the average radiative flux. For example, doubling the amount of CO2 in the atmosphere changes the radiative budget by about 4 W/m² (3.8 W/m² to be more exact), as if the sun was 4/240*100=1.7% brighter.
The scientific report of the Intergovernmental panel for climate change (IPCC) attempts to summarize the effects of all the drivers. This is displayed in the famous forcing graph below. There are several interesting points one should note. First, there is a large uncertainty in an anthropogenic contribution called the indirect aerosol effect. This effect arises from the fact that increased amounts of small particles in the atmosphere will alter the characteristics of clouds. This is best seen downstream of chimney stacks or in marine clouds in the form of ship tracks. Since cloud formation, and in particular, the characteristics of clouds, is not well understood, the indirect aerosol effect is highly uncertain. The second point to note is that the solar forcing quoted by the IPCC is 0.3 W/m². This does not include the effect of the solar modulated cosmic ray flux, which has ample evidence to support it, and no real evidence to refute it. If one includes the effects of cosmic rays, an additional 1 W/m² should be added because of the increased solar activity (which reduced the flux of cosmic rays reaching Earth, as will be explained below).
Fig. 2:
Anthropogenic and Natural contributions to the net radiative forcing.
Figure from the IPCC TAR. If one adds their numbers (which are supposed to capture the
community's consensus, one finds an Anthropogenic forcing of: 0.8 ±
1.3 W/m² (where the errors were added in quadrature, assuming
independence). In other words, the large uncertainty in the indirect
aerosol effects, implies that the sign of the Anthropogenic
contribution is unknown!
Climate Sensitivity
Next, if we wish to translate the anthropogenic contribution to the radiative budget (assuming we knew it!) into a global temperature change, we need to know the global climate sensitivity. That is, we need to know the change λ in °C associated with a radiative forcing of 1 W/m². It can also be quantified with ΔTx2, which is the temperature increase associated with doubling the amount of CO2, i.e., a change of 3.8 W/m² in the radiative budget. If Earth behaved as an ideal black body, its sensitivity would be &lambda≈0.3°C/(W/m²), or ΔTx2≈1.2°C. However, Earth's sensitivity does not necessarily behave like that of an ideal black body. The reason is that as the temperature changes, other variables affecting the temperature change as well. For example, increasing the radiation budget, increases the temperature. This will increase the amount of water vapor in the atmosphere. However, water vapor is a great GHG. So, this will tend to increase the temperature further, thus giving rise to a positive feedback, which increases the sensitivity. On the other hand, the larger amounts of water vapor in the atmosphere imply more cloud cover. Since clouds have a net tendency to cool, this will counter the increase in temperature, thus giving rise to a negative feedback that decreases the sensitivity.The problem with numerical simulations of climate is that the feedbacks, especially those pertaining to cloud cover, are very poorly understood. As a result, any value in the range of Tx2≈1.5-4.5°C is believed to be possible according to the IPCC. In other words, based on theory (well, numerical simulations to be more exact), the temperature change associated with doubled CO2 is not known to within a factor of 3!
So, can CO2 be incriminated?
Evidently, according to the scientists behind the IPCC report, i.e., those who support Kyoto:- It is not clear how much is the actual anthropogenic contribution to a changed radiation budget (again, even the sign of the anthropogenic effect is not known).
- Even if the anthropogenic radiative forcing was better known, it is theoretically unclear by how much the temperature should have varied in response.
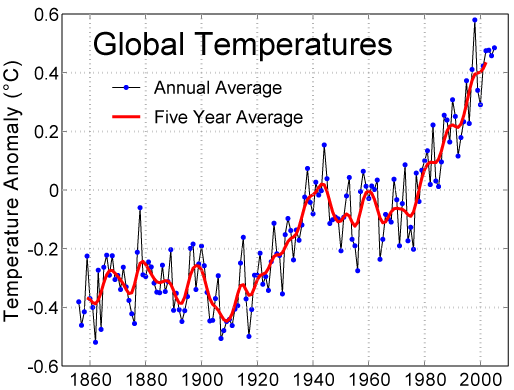
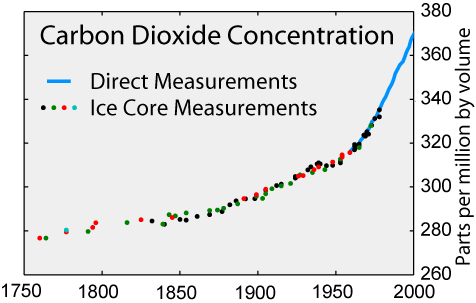
Clearly, the incrimination of CO2 (and other GHGs) is primarily because we expect it to warm (see fig. 4), and we do see warming (see fig. 3), but it turns out that there are other suspects.
Fig. 3:
Global Warming over the 20th century. Half the increase took place in the beginning of the previous century, long before the bulk of the human influence took place. Is this warming anthropogenic or natural? (image source:
Wikipedia)
Fig. 4: Carbon Dioxide in the atmosphere. Just like the global temperature, it increased over the 20th century. Since theoretically we expect the gas to warm, it is often incriminated as the main culprit behind global warming. But there is no direct evidence proving that it is it which is the primary warmer and not another mechanism.
(image source:
Wikipedia)
An alternative explanation for global warming, or at least part of it
Solar activity appears to affect climate. This can be seen from many different correlations between solar activity on one hand, and climate on the other. These correlations exist on time scales ranging from the 11-year solar cycle to many millennia (for the two most beautiful correlations, see Neff et al, and Bond et al. in the refs below). Such a link is potentially important for global warming because over the 20th century, solar activity has been increasing.Because the solar correlated climate variations are large, but the total solar irradiance variations are relatively small (a few 0.1%), the latter are most likely not the explanation of climate variability. Instead, different amplifying mechanisms were suggested, mechanisms which can amplify the non-thermal components of the sun (e.g., UV, X-ray, solar wind) and which can considerably vary between an active sun and a quiet one.
The leading mechanism to explain the large solar induced climate variability is through solar wind modulation of the cosmic ray flux reaching the Earth, which affects climate through modulation of the amount of atmospheric ionization. Over the past decade, many different pieces of evidence added up to a pretty coherent picture.
The activity of the sun manifests its self in many ways. One of them is through a variable solar wind. This flux of energetic particles and entangled magnetic field flows outwards from the sun, and impedes on a flux of more energetic particles, the cosmic rays, which come from outside the solar system. Namely, a more active sun with a stronger solar wind will attenuate the flux of cosmic rays reaching Earth. The key point in this picture is that the cosmic rays are the main physical mechanism controlling the amount of ionization in the troposphere (the bottom 10 kms or so). Thus, a more active sun will reduce the flux of cosmic rays, and with it, the amount of tropospheric ionization. As it turns out, this amount of ionization affects the formation of condensation nuclei required for the formation of clouds in clean marine environment. A more active sun will therefore inhibit the formation of cloud condensation nuclei, and the resulting low altitude marine clouds will have larger drops, which are less white and live shorter, thereby warming Earth.
Today, there is ample evidence to support this picture (a succinct introduction can be found here). For example, it was found that independent galactic induced variations in the cosmic ray flux, which have nothing to do with solar activity do too affect climate as one should expect from such a link. There are many more examples. [Added Note (4 Oct. 2006): These recently published experimental results stroingly point towards the validity of this link, as expected]
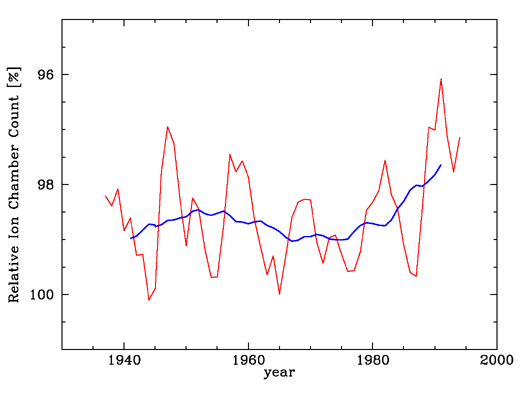
So why is this link important for global warming? As previously mentioned, solar activity has been increasing over the 20th century. This can be seen in fig. 5. Thus, we expect warming from the reduced flux of cosmic rays. Moreover, since the cosmic ray flux actually had a small increase between the 1940's and 1970's (as can be seen in the ion chamber data in fig. 6), this mechanism also naturally explains the global temperature decrease which took place during the same period.
Using historic variations in climate and the cosmic ray flux, one can actually quantify empirically the relation between cosmic ray flux variations and global temperature change, and estimate the solar contribution to the 20th century warming. This contribution comes out to be 0.5±0.2°C out of the observed 0.6±0.2°C global warming (Shaviv, 2005).
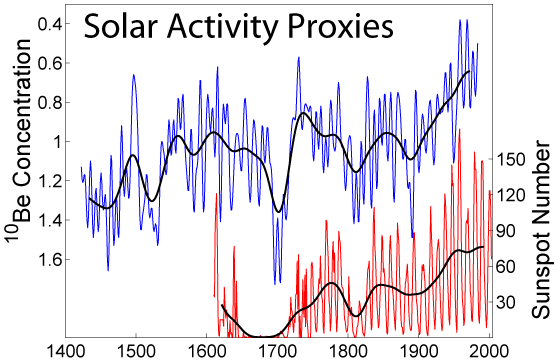
Fig. 5: Solar activity over the past several centuries can be reconstructed using different proxies. These reconstructions demonstrate that 20th century activity is unparalleled over the past 600 years (previously high solar activity took place around 1000 years ago, and 8000 yrs ago). Specifically, we see sunspots and 10Be. The latter is formed in the atmosphere by ~1GeV cosmic rays, which are modulated by the solar wind (stronger solar wind → less galactic cosmic rays → less 10Be production). Note that both proxies do not capture the decrease in the high energy cosmic rays that took place since the 1970's, but which the ion chamber data does (see fig. 6).
(image source:
Wikipedia)
Fig. 6: The flux of cosmic rays reaching Earth, as measured by ion chambers. Red line - annual averages, Blue line - 11 yr moving average. Note that ion chambers are sensitive to particles at relatively high energy (several 10's of GeV, which is higher than the energies responsible for the atmospheric ionization [~10 GeV], and much higher than the energies responsible for the 10Be production [~1 GeV]). Plot redrawn using data from Ahluwalia (1997). Moreover, the decrease in high energy cosmic rays since the 1970's is less pronounced in low energy proxies of solar activity, implying that cosmogenic isotopes (such as 10Be) or direct solar activity proxies (e.g., sun spots, aa index, etc) are less accurate in quantifying the solar → cosmic ray → climate link and its contribution to 20th century global warming.
Summary
As explained above, there is no real direct evidence which can be used to incriminate anthropogenic greenhouse gases as the being the main factor responsible for the observed global warming. The reason these gases were blamed are primarily because (1) we expect them to warm and indeed the global temperature increased, and (2) there is no other mechanism which can explain the warming.Although this reasoning seems logical, it turns out that (1) We don't even know the sign of the anthropogenic climate driving (because of the unknown indirect aerosol effects), and (2) There is an alternative mechanism which can explain a large part of the warming.
Solar activity can explain a large part of the 20th century global warming, on condition that there is a strong solar/climate link through modulation of the cosmic ray flux and the atmospheric ionization. Evidence for such a link has been accumulating over the past decade, and by now, it is unlikely that it does not exist.
This link also implies that Earth's global temperature sensitivity is also on the low side. Thus, if we double the amount of CO2 by 2100, we will only increase the temperature by about 1°C or so. This is still more than the change over the past century. This is good news, because it implies that future increases in the amount of atmospheric greenhouse gases will not dramatically increase the global temperature, though GHGs will probably be the dominate climate driver.
A clarifying note
So, as you may understand, I am quite sure Kyoto is not the right way to go. I should however stress that there are a dozen good reasons why we should strive to burn less fossil fuels.The two primary reasons why fossil fuels are bad are of course pollution and depletion, while minor reasons include for example the fact that many fossil fuel reserves are controlled by unpleasant governments.
Thus, I am very much in favor, and always have been, in using less fossil fuels and keeping the environment clean (I am proud to say that I grew up in a solar house), but we should do things for the right reasons, not the wrong ones (and I don't see Kyoto addressing the right reasons). I am therefore in favor of developing cheap alternatives such as solar power, wind, and of course fusion reactors (converting Deuterium into Helium) which we should have in a few decades, but this is an altogether different issue.
More Reading Material
- A short exposé about the evidence for cosmic rays and climate can be found in this non-technical article. In a while, a details summary of all the evidence pointing to a cosmic ray climate link will appear on this site.
- More on the empirical determinations of Earth's climate sensitivity, and in particular, the role of cosmic rays, can be found here (somewhat technical).
- The best example of cosmic rays flux induced climate variations, which are not related to solar activity, are the passages of the solar system through the milky way's spiral arms and the clear paleoclimate signal observed.
Notes and References
- All the information about the evidence for global warming, about the anthropogenic climate drivers, and about the numerical models can be found in the Scientific Reports of the Intergovernmental Panel for Climate Change (IPCC). Their reports do not include deficient with regards to all which is related to solar forcing.
- Perhaps the most beautiful correlation between a solar activity and climate proxies can be found in the work of U. Neff et al., "Strong coherence between solar variability and the monsoon in Oman between 9 and 6 kyr ago", Nature 411, 290 (2001).
- Another beautiful correlation between solar activity and climate can be seen in the work of G. Bond et al., "Persistent Solar Influence on North Atlantic Climate During the Holocene", Science, 294, 2130-2136, (2001).
- The detailed analysis behind the empirical determinations of Earth's climate sensitivity, and in particular, the role of cosmic rays, can be found in: Shaviv N., "On Climate Response to Changes in the Cosmic Ray Flux and Radiative Budget" JGR-Space, vol. 110, A08105, 2005, (PDF).
Comments (61)
If we assume that increased atmospheric CO2 causes temperature increase, and we assume also that the oceans are the primary CO2 sink, and that increasing temperature reduces the oceans' capacity to remove CO2 from the atmosphere, we have described a positive feedback loop. How do we explain why temperatures and CO2 levels don't go always up?
Higher temperature does reduce the solubility of CO2 in water. But higher CO2 increased solubility proportionally. THe later effect is larger than the former. Hence as CO2 rises, more absorbs into the ocean. For example, the CO2 released by the combustion of just petroleum is sufficent to produce all of the 2ppm/yr CO2 rise that is seen today. Obviously the combustion of coal and natural gas adds additonal CO2 to the air. A goodly fraction (roughly half I believe) of human-generated CO2 is removed from the air each year, largely by the oceans.
The famous CO2 temperature correlation seen over the past 600,000 years (as shown in Al Gore's inconvenient truth for example), is simply the result of the equilibrium relation between dissolved CO2 and atmospheric CO2, an equilibrium which depends on the temperature.
All that this graph is showing is this equilibrium, nothing more, nothing less.
Of course, CO2 may have a feedback effect on the temperature, so part of the rise is due to the CO2. But there is no way of knowing how much from just this graph. It is clear that not all of it given that the CO2 appears to lag the temperature and not vice versa.
As for the CO2 feedbacks you describe, it is clear that if those were large, a large temperature variation would ensue. In fact, one can estimate the climate sensitivity required to make this feedback diverge and give a runaway effect.
Temperature variations of 4 degrees give rise to CO2 variations of about 80 ppm, or typically to a changed forcing of ln(80/240)/ln(2)*4 W/m2 ~ 2 W/m^2. If climate sensitivity is larger than 2 deg/(W/m^2), or 8 degrees for CO2 doubling, then Earth's climate would have been totally unstable due to CO2 feedback. We would have ended up as either Venus or a cold Earth. Luckily, the sensitivity is more like a 1 to 1.5 deg increase for CO2 doubling. This implies that CO2 has at most a ~20% amplification effect.
Does't the solar forcing theory violate the First and Second Laws of Thermodynamics?
The cosmic ray/solar forcing theory basically assumes the cosmic rays control the cloud cover which serves as an "iris" which lets more or less solar irradiance in. There is nothing in it which breaks the first law (=conservation of energy), since the energy comes from the irradiance (instead of being reflected away). There is nothing which breaks the second law, either, in particular because it is an open system.
My understanding is that only high energy cosmic rays are related to the cosmic ray model because lower energy particles don't make it through the atmosphere. Wouldn't ground obervations of cosmic rays measure the kind of high-energy rays of interest (the lower energy ones having been blocked by the atmosphere)? This station at Moscow is at a 200 m elevation and so is shielded by almost all of the atmosphere. Here is a plot of comsic ray measurements.
http://helios.izmiran.rssi.ru/cosray/Images/months.gif
This chart looks pretty much like the plots from the Climax CO station which is at 3000 m elevation.
http://ulysses.sr.unh.edu/NeutronMonitor/Misc/neutron2.html
What I don't see is comsic ray intensity rising at a time when sun spots are not rising, such as the last half century. Doesn't this have to be the case for the comsic ray mechanism to be operative for the post-1975 warming?
Dear Mike,
First, you are correct that high energy cosmic rays are those which should be of any relevance. Note however that the neutron monitors don't actually measure the relevant particles. They are sensitive to neutrons which come from further up the atmosphere as the ionizing particles (because the neutrons have a longer mean free path). Ion chambers have the opposite problem. Because of their shielding, they are sensitive to cosmic rays of higher energies than those likely relevant to the weather.
In any case, there are two reasons why the temperature should rise from the 1970's.
First, there is a decrease in the average cosmic ray flux. If you look at the average of each cycle (e.g., in the graphs that you have sent), you will see that there is an increase in the average cosmic ray until about the cycle of 1970, and then a decrease in the following two cycles. Note that the last cycle was not as strong, so the average CRF increased. This can explain why the temperature stopped warming from around 2000.
Second, one has to realize that the temperature response of Earth's climate is a low pass filter due to the high heat capacity of the Oceans. This implies that:
- The temperature variations over the 11 year cycle are highly damped (but they are there at a level of 0.1 deg).
- There is a delay time in the system's response. This means that the 11-year cycle will lag the solar forcing (and it does by 1-2 years). Over the centennial time scale, the sun's activity significantly increased until the middle of the century, then it slightly decreased and somewhat increased from the 1970's. If you pass this behavior through the climates "low pass filter", you will find that because of Earth's heat capacity, the temperature at 2000 should be higher than the temperature in 1950's even if the decrease until the 1970's is similar to the increase afterwards.
I plotted CRF from three sources Climax, Haleakala-Huancayo and Moscow as a function of time. Also shown is sunspots plus 1700. 11-year moving averages are used to visualize the trends. The result is here:
http://my.net-link.net/~malexan/Cos-Ray-Sunspot.gif
The Climax and Haleakala-Huancayo trend is flat:
For Climax average counts over 1951-1973 was 3956 (sd = 263) and over 1984-2006 it was 3939 (sd = 282). A t-test shows these values are not statistically different (p = 0.47)
For Haleakala-Huancayo average counts over 1952-74 was 1712 (sd = 32) and over 1984-2006 it was 1703 (sd = 37). A t-test shows these values are statistically different (p = 0.002). The change however is very small, a mere 0.5% drop.
The Moscow data does show a statistically significant drop from 8989 over 1958-1980 to 8737 over 1984-2006. This drop is about 2.8%.
Sunspots also fall from an average value of 77 (sd 55)over 1950-72 to 68 (sd 46) over 1983-2005. These values are not statistically different (p = 0.58).
On the other hand sunspots in the 1900-1922 period averaged 36 (sd 28). This value is statistically different from either of the above periods p=0.003 for the 1950-72 period and p=0.007 for the 1983-2005 period. This difference reflects a large change.
The graph shows visually how the rising trend in sunspots is larger that the fluctuations after 1950.
The following papers by Lockwood examine several characteristics of solar activity including sunspots and cosmic rays. The trends in these papers show much larger changes in this quantities during the first half of the 20th century as compared to the second half. From this, it seems to me that the change in CRF over the 1900-1950 period was in all likelihood considerably larger than the change over the past five decades. That is, if I had data to plot I believe that the CSF flux plots over 1900-1950 would show trends that were much more pronounced than those shown in the figure for more recent decades.
That is the temperature rise in the early 20th century was associated with a large change in solar activity and CSF, while the similar-sized temperature rise since 1975 is associated with small change in solar activity/CSF. Thus, the impact of solar activity/CSF on the post-1975 temperature change should be much less than its impact on the early 20th century temperature rise.
For centuries before ~75 years ago, CO2 was range bound in a fairly narrow range. Since then CO2 has risen far above this range. Thus, it is only in the post-1975 warming that CO2 has been in a position to exert a major effect on temperature. Since the change in the solar factors is so much smaller than they have been in past period of temperature change, it stands to reason that CO2 is the predominate effector in the recent warming whereas solar/CSF factors were the predominate effector in the early 20th century warming (and previous ones).
http://www.eiscat.rl.ac.uk/Members/mike/publications/pdfs/2002/davospapercrcsent.pdf
http://www.eiscat.rl.ac.uk/Members/mike/publications/pdfs/2003/213_Lockwood_2002JA009431.pdf
I think that Dr. Shaviv is saying, that the low energy neutrons detected by neutron counters are more or less irrelevant because they are uncharged and don't interact with much.
They also travel for fairly long distances for this reason.
Yes, you're right, a low-energy cosmic ray detector would expect to see a lower flux of primary low-energy cosmic rays (usually protons, charged lithium, beryllium, boron, carbon, oxygen and god knows what else) at a lower altitude, but the flux of incident secondary neutrons may not decrease much with decreasing altitude. Why? Because neutrons are uncharged and travel pretty far more or less unimpeded. So a collision of a charged low-energy cosmic ray (e.g. lithium, beryllium) in the upper atmosphere still gets detected by a neutron detector situated on the ground, even though the primary cosmic ray could never make it that far.
Your plots on low altitude (Moscow) vs. high altitidue (Climax, Huancayo) are interesting, but it's likely that even the low altitude detector is detecting a lot of neutron shower originating from low energy cosmic rays colliding in the upper atmosphere.
Sure, these neutron detectors are probably detecting shower from higher energy cosmic rays as well, but the signal is likely to be drowned out by events arising from lower energy cosmic rays. Keep in mind, cosmic ray flux drops precipitously as energy increases.
See this plot of the cosmic ray spectrum:
http://en.wikipedia.org/wiki/Image:Cosmic_ray_flux_versus_particle_energy.svg
This link discusses it as well:
http://www.auger.org/qa/qa.html#milky_way
"For 1 GeV particles, the rate is about 10,000 per square meter per second. At 1000 GeV (or 1012 eV), the rate is only 1 particle per square meter per second."
So I guess it's a bit paradoxical, but it seems like to me, you might expect that a neutron detector tuned to detect lower energy indicent neutrons may actually be detecting a higher percentage of particles originating from the collisions in the upper atmosphere than a comparable detector which detects very high energy incident charged particles which are capable of penetrating deep into the atmosphere.
Dr. Shaviv:
Having now read through all the comments on this article most of my questions I posted earlier are now answered. A few new ones though. Pertinent to Mike Alexander's post is it possible to do the low band pass filter and the lag effect you mentioned to get some real numbers and a CRF vs. Temp curve for the period over which we have good data? This would help. Also when you have time I would love your comments on the Lockwood paper Mike referenced. Are there any proxies or tools to get a measure on the proper energy levels of cosmic rays for cloud formation? Be 10 worked so well for the Holocene even though it picked up lower energies- does it not work well for more recent cycles or is there a lack of data? Is it better than neutrons or ion measures even though it is low energy sensitive? When I debate others they are sometimes willing to back off on the Phanerozoic connection to CRF but say its not relevant to what is happening today. That is why better data fits are needed to more recent periods - and why Lockwood is troublesome for the theory. Svensmark has some data in his recent paper (Cosmoclimatology)that shows the Maunder and Dalton minimums but its very rough looking and nothing is discernable on his scale into the 20th century. By the way, Foukal's 2002 paper where he incorporated UV data had a very good statistical fit of solar irradiance and temperature up through 1999. What is the reason for that? Can we learn something from it.
Thank you very much:
Peter
Figure 6 from Lockwood 2002 shows a plot of the 11-year moving average of the Open Solar Flux. I attempted to reproduce this graph in Figure 1
The Open Solar Flux are the solid symbols labeled "Open Flux". Also plotted as open triangles is an 11-year moving average of the Cosmic Ray Flux (CRF) in counts/minute as measured by the neutron detector at Climax CO. The CSF is plotted as the negative so up is lower and down is higher. This allows the good correlation between solar flux and CSF to be shown.
Figure 2 shows a plot of the Open Solar Flux and Sunspots.
The data in Figure 2 was regressed to obtain a relation between OSF and sunspot number which is shown in Figure 3. This relation was used to extend the OSF plot back to 1850. The data in Figure 1 was regressed to obtain a relation between CRF and OSF which is also shown in Figure 3. This relation was used with the extended OSF plot to extend the CSF plot back to 1850.
Figure 4 shows a plot of the 11 year moving average of the reconstructed Cosmic Ray Flux. After 1956 the plot shows the actual Climax data. Before 1956 it shows the regression model from Figure 3. Also shown in the figure is the temperature data since 1850.
This figure shows what I was trying to point out earlier. If you scale the figure so that the change in CRF between 1900 and 1950 roughly matches the temperature rise over this time (as I have done) you will see that the change in CSF over the 1950-2000 period is too small to explain the temperature rise over this period.
Since all these are 11 year moving averages, the effect of filtering is already in the plots.
Dear Mr. Shaviv,
On page re: Carbon Dioxide or Solar Forcing, fig. 6 is partly missing.
Yvon Dionne
The best suggestion that I've heard for disposal of rad waste is vitrify, seal in stainless steel, and drop into a subduction zone in the bottom of an ocean. The objects will slowly be sucked into the mantle of the earth, and by the time they actually contact magma, the radioactivity will be nil.
I agree with Nir that the most serious problem with fission is the possibility of using a reactor to make Pu239.
but in practice, I think that as long as it is close to the ocean floor, the "activity" of the region may actually hamper the steel casing and disperse the radioactive material. Perhaps a better option would be to bury it in a geologically "dead" region. For example, nothing dramatic happened to the canadian shield is 2.5 billion years... so its pretty safe to bury it there. I think.
Frankly, I think Global Warming is already at the bottom of most people's list of concerns. This conclusion is based on my discussions with dozens of people from many different walks of life and educational backgrounds. Some are deeply concerned, but it is a very tiny minority. There are just too many pressing daily concerns in people's lives to get very upset about the prospects of Global Warming now or in the future. Their personal experience and senses tell them that the media hype is over blown. The feedback I'm getting correlates with age. The older and more experienced the person is, the more likely they are to believe that 1) Global Warming is NOT anything to get excited about and 2) people are NOT personally responsible for what little warming there might be. Younger, less educated and experienced people are more likely to believe just the opposite. Going forward, the more people of all ages and backgrounds are pressed economically due to Peak Oil, the more likely Global Warming will fade from their worry list. I think Maslow would agree. On a scale of 1 to 10, Peak Oil is an "11", and Global Warming is a "1". Like in the movies "Spinal Tap" and "10", people are going to focus on the "11", for obvious reasons. More and more I find people just tuning out the Global Warming hype. This will only accelerate as fuel availability declines and prices climb as a result of the global Peak Oil decline in petroleum production, regardless of today’s weather. Therefore, it is not surprising the Democratic Party push for all of us to "Pay a carbon offset tax and change the weather" is a source of growing anger among common folks across the nation, especially those suffering under the burden of commuting and heating expenses. “Carbon offset taxes” and “cap-and-trade” Ponzi schemes will quickly double and triple those expenses and the politicians will get even richer. Look at the hypocrisy of Al Gore’s message in the face of his highly publicized energy intensive lifestyle in Tennessee.
To a large extent, I agree with what you write. I personally think that the increasing prices of oil will eventually push us towards alternative energy sources, irrespective of the global warming hype. If we, as in humanity, are smart, we should do it earlier because it entails with it other benefits (e.g., less real pollution). In any case, the carbon trading schemes are no better than the indulgences of the Catholic church in the middle ages. Since the bottom line is the development of alternative energy sources, why waist money on middlemen like Al Gore, Enron, Rebulicans or Democrats. Simply, invest directly in the research and be done with it.
I read that around 1900, Aangstrom studied the ability of CO2 to absorb radiation by filling a tube with an amount of CO2 equivalent to the amount from the surface of the earth to the edge of the atmosphere. He then measured the amount of infrared radiation passing through the tube. When he doubled the amount of CO2,he found that the amount of radiation that passed through the tube did not decrease. He concluded that absorbtion of infrared radiation was limited to a specific wave-length range and that the CO2 absorbed all the radiation in that range. His tests were discredited by another physicist through a theoretical analysis that concluded that Aangstom's test did not represent what actually happened in the atmosphere. Apparently, the scientific community at the time accepted the theoretical analysis.
Since the 1980's, NASA has been studying the earth's radiation budget. Aangstrom was correct in concluding that the absorbtion of infrared radiation is wave-length specific. Scientists have been able to identify atmospheric composition of planets such as Venus by their radiation spectrum. We should know from ground stations and satellites how much radiation we get from the so-called green house gasses, how much over that wave-length range escapes into space and what the trend has been over the last 25+ years. The data should be available, but I have looked online for any report of the kind, and have not been able to find anything. Do you know of any published studies in this area?
Regarding the Ahluwalia article cited above, Gavin Schmidt (you know who...) claims this trend to be an artefact of adjusting the Yakutsk data 1953-63. Ahluwalia presents some justification on his own in his paper, but I wonder if you can elaborate your view a bit.
Gavins position seem to be untenable as he both claims there is no trend in high energy cosmic rays, and that high energy cosmic ray intensity should follow low energy cosmic ray intensity, and that the trend in low energy cosmic rays peaked in the sixties. (One of these positions is bound to wrong, I just wonder which one.) As a layman I would guess that the intensity of the spectrum reaching earth might vary quite a bit, even without the suns influence.
I just finished reading 'The Chilling Stars' by Henrik Svensmark and Nigel Calder and came across your research on the earth's journey through the galaxy and its effect on the climate. I think this research (and also Svensmarks) undeniably shows the relationship between cosmic rays and the earth's thermodynamic state. If the IPCC were a truly scientific body it would welcome these findings, weigh them and try to incorporate them into their models. No signs of them in AR4 however. Apart from my general interest in dynamic systems (and simulation of them), my particular interest in this subject stems from my disdain for politicians and media that parrot the IPCC's conclusions of anthropogenic climate change. These (ignorant) people have the power to change our lives (through legislation, taxes and education)! In my opinion the general public is being scared without any probable reason. So let's try to open more people's eyes for these alternative theories explaining what we're experiencing now, have experienced in the past and most likely are going to experience in the future. Keep up the good science!
I sent Dr. James Hansen (a leading proponent of man-made global warming) some questions that you seem to answer in your article above. I would also add that other possible causes of positive radiative forcing include the procession of the Earth's axis by 23 degrees every 26000 years coupled with the eccentricity of Earth's orbit which (I've read, but not confirmed to my satisfaction) switches between more ciricular to more elliptical orbits every 100000 years.
Dr. Hansen sent the following response:
These questions are answered rigorously in papers at www.giss.nasa.gov Go to Publications, then Authors, then my name. Two papers in particular that you might start with are the one titled "Dangerous..." in Atmos. Chem. Phys. in 2007 and the one in Phil. Trans. Roy. Soc. also in 2007. Jim Hansen
On Jan 23, 2008 10:13 PM, Gene Mangrum gene.mangrum@comcast.net wrote:
I find it ironic that you are asking for feedback and response to a letter that you sent the Chancellor of Germany and the Prime Minister of Britain, when you do not respond to emails sent to you. I asked what I think are some extremely important questions in a previous email (which I will again ask below), but you failed to respond. I would again ask that you respond. If you, as a citizen, expect those whom you ask questions to respond, you should respond to legitimate questions posed to you. Here are the questions again:
Dr. Hansen,
A simple question: What evidence exists that shows conclusively (or at least, persuasively) that 100 parts per million (ppm) in of C02, which is man's maximum contribution to the total amount of C02 in the atmosphere (which totals ~400ppm), actually causes the Earth's temperature to increase? What evidence exists that proves conclusively that 100 ppm of C02 causes the Earth's atmospheric temperature to rise by X degrees Celsius?
I saw Al Gore's graph of C02 in the atmosphere superimposed on the fluctuation of Earth's temperature over a period of thousands of years, in his farce of a movie "Inconvenient Truth". Does that show causation? Could the reverse be true, that the temperature fluctuations CAUSED the C02 fluctuations? The causal correlation between C02 and temperature increase seems a bit spurious to me (but I don't know that…I would like to see evidence that affirms it though).
When I ask the average Joe Sixpack out there, the percentage of the total atmosphere which C02 comprises, I get responses of no less that 10%...and more often 25% or more. People actually think C02 makes up 10 to 20% of the atmosphere! How can the public make educated decisions about C02 emissions when they don't even know that C02 makes up less than 0.05% of the atmosphere? While I agree that big oil and other right-wing corporate interests are financing the skeptics of global warming, isn't there an agenda on the left as well to use the issue of alleged man-made global warming as a means to achieving certain socialist/leftwing regulatory agendas? I've also noticed an extremist cult-like orthodoxy developing among proponents of man-made global warming that resembles other primitive eschatological cults. These people WANT to believe man is hurting the environment because it fulfills their eschatological delusions. There is also an extremist orthodoxy in academia that is driven by political correctness…itself, driven by the conformist, obsequious and sycophantic grant culture. This all smacks of propaganda and agendas…not true science.
Another distinction that the public seems not to understand is the distinction between global warming and MAN-MADE global warming. I've witnessed a lot of evidence that supports the idea that global temperatures may be rising (as well as evidence that attributes some of this warming to natural variability). However, I've seen NO direct, irrefutable, verifiable, and conclusive evidence that any man-made activity contributes to these possible global warming trends. The subtle distinction is: 1.) global warming, does it exist? and 2.) if it exists, does man cause it? I can believe the evidence from ice core samples that show variability in the temperature of Earth's atmosphere down through the eons. However, to go from that to man-made causes for temperature fluctuations is a HUGE leap, and is supported by the flimsiest evidence.
I ask you to point me to evidence for the latter. I ask you to SHOW me the evidence that points to a HUMAN cause for global warming. I don't want to hear "well, the ice caps are melting". In the 60 minutes interview, Scott Pelley starts out the piece (I paraphrase) "Evidence is mounting that man is causing global warming", and then he gives examples of evidence of global warming, but no evidence that man is causing global warming. It's as if the logic is: "Global warming exists, and man causes it". This is absurd, presumptuous, and misleading. The piece gave NO evidence that man-made "greenhouse gases" causes global warming. There is no evidence to date that shows that man's measly contribution of 100 to 300 parts per million of so-called "greenhouse gases" over a period of hundred years is causing global warming.
Again, I don't need any more evidence that global warming exists. I need evidence that shows man is causing the global warming.
Gene Mangrum
Nashville, TN
--------------------------------------------------------------------------------
From: James Hansen [mailto:jhansen@giss.nasa.gov]
Sent: Wednesday, January 23, 2008 9:16 AM
To: jhansen@giss.nasa.gov
Cc: jhansen@giss.nasa.gov
Subject: Dear Chancellor
To be removed from Jim Hansen's e-mail list respond with REMOVE as subject
Dear Chancellor, Perspective of a Younger Generation is available at:
http://www.columbia.edu/~jeh1/mailings/20080122_DearChancellor.pdf
Jim
Dear Chancellor, Perspective of a Younger Generation
I did not send a letter to Dr. Merkel similar to the one to Prime Minister Brown ( http://www.columbia.edu/~jeh1/mailings/20071219_DearPrimeMinister.pdf ), as I had intended, because the Chancellor's advisors told me that she was very well aware of all the facts therein and would likely consider the letter patronizing.
Now I have revived and modified the letter with the encouragement of younger Germans. Their hope is that Dr. Merkel will appreciate the truth in the message and ally herself with them regarding coal-fired power plants. I especially appreciate the insights and editorial assistance of Maiken Winter, who expects to meet soon with Chancellor Merkel and will carry the letter.
The fact that energy and climate advisors, in Germany, the United States, and elsewhere, do not understand the problem is starkly illustrated by repetition of goals to reduce CO2 emissions by a percentage (say 40% by 2020, 80% by 2050, or other numbers), while at the same time allowing construction of new, more efficient, coal-fired power plants that do not capture and sequester CO2. However laudable and ambitious the goals are (in some cases they may be unrealistic), this approach spells doom for life on the planet.
Part of the difficulty in grasping the problem may be the common misstatement that the atmospheric lifetime of fossil fuel emissions is 50-200 years (Maiken finds this error in a current U.S. EPA document). In point of fact, a large fraction of the CO2 increment remains in the air for more than 1000 years, and the mean lifetime, dominated by this long tail, is about 30,000 years (D. Archer, Fate of fossil fuel CO2 in geologic time, J. Geophys. Res. 110, C09S05, 2005).
The upshot, which I am confident Dr. Merkel will understand, is that we must have a prompt moratorium on the construction of coal-fired power plants that do not capture CO2, and we must phase-out existing coal-fired power plants over the next two decades. It is foolish to build new plants with the knowledge that they will have to be bull-dozed in the near future.
Given the fossil fuel facts summarized in the letter, the alternative to elimination of CO2 emissions from coal use would be to place a contraption on the back of each of our automobiles to capture the CO2. Remember that the mass of the CO2 is more than three times larger than the mass of the fuel in the tank. Can you imagine the price of this contraption? And where are you going to take and stow the CO2 after you capture it?
One of my next posts will be a paper that I hope makes the story clearer. We are now on the hairy edge. We are, in fact, going somewhat beyond the safe level of atmospheric CO2, but there is enough potential for storage of CO2 in soils and the biosphere that we can take care of the excess via improved agricultural and forestry practices, improvements that make sense for other reasons – provided that we phase out coal use except where CO2 is captured and sequestered.
Old geezers living on high ground may not be concerned about ice sheet stability and future sea level rise, or the out-of-control mess that we threaten to leave for coming generations. However, when one looks at species loss and its relation to climate change, simple calculation shows that each new coal-fired power plant will be a dagger in the heart of at least several irreplaceable species, even though we cannot identify specific species with a specific power plant.
My letter to Chancellor Dr. Merkel follows.
Jim Hansen
Dear Professor Shaviv,
I am a teacher and associate researcher in Journalism at the Andres Bello Catholic University (UCAB) in Caracas, Venezuela. Congratulations on your very interesting work.
We are organizing a Forum on Climate Change for April 2008, and are in need of a Science Journalist or Climate researcher representing the skeptical, or perhaps "middle" point of view on the subject and who could speak in Spanish (translation services are very expensive here). Could you give me some hints?
Thanks a lot
Sami Rozenbaum
I read your article with interest, and have one question:
You claim that global warming is not the right reason for burning le fossil fuels.
From your article I understand that there is no proof that we are the major contributors to the global warming, BUT that we MIGHT be, if the we use the upper side of the error bar (i.e. 0.8+1.3=2.1 w/cm^2, or even more than that).
Judging cost against danger, it seems to me that this IS A RIGHT REASON for burning less fossil fuels.
Am I wrong ?
I've read your publications, it's not may subject (I'm geologists) but I think they are very, very interesting and have open an important way to investigators.
Many things we are reading about high clouds. ¿Maybe they can act as amplifiers of the effect of solar cosmic rays? Maybe the total amount of energy coming from solar storms and flares is not very big compared with the total energy flux from the Sun, but their peaks could act as pulses that provoke those high clouds in a similar way to boreal auroras. The effect of those peaks (short and strong) may be different from the effect of a weak continuous irradiance.
There is an analogy with infiltration in aridic regions. The pulse of rain may provoke infiltration, the same amount of rain shared along the whole year can't stand evaporation and infiltration is not reached.
I'm interested in the subject because if you add the effect of low clouds during the low solar activity periods (freezing) to that hypothetic effect of high clouds during the high solar activity periods (warming) the sum might by higher.
Thanks
-- ScienceBits team
Dear Nir Shaviv,
have you checked the Data hacked during the hacking incident at the University of East Anglia with reference to your work? Best regards
Hi I have long doubted the ability of the IPCC to state so certainly that man made CO2 is the cause of the warming given the climate forcings-scientific level of confidence graph they produce. And circumstantial evidence is not sufficient.
I have one further concern, the accuracy of the global temperature product form NOAA GISS and CRUT. I really have little confidence in it, and now there seem to be problems with satellite sensors. So my question is, how much warmer has it really got since 1980? I would like to see a raw rural data set before I could answer that question.
But ultimately, since CO2's effect seems to be weak, we should not hesitate to produce it since its small effect will help stop the gradual temperature decline of the last 5000 years, and help agriculture immensely. An ice age is the last thing we want, yet a few degrees warmer is perfectly supportable since we thrived during such conditions a few thousand years ago.
But for many reasons I too am in favour of alternative energy sources.
I would like to extend to you personal invitation to check my feature length documentary on the “cold facts” of Global Warming entitled “The Boy Who Cried Warming,” available in full at www.theboywhocriedwarming.com. The virtual premier has been enjoyed by over 12,000 viewers due to a grassroots campaign effort of handing out flyers and emailing people just like you! We are independent filmmakers without corporate sponsorship, every view counts to us, and we would truly appreciate if you would take a look and (if you enjoy the film) encourage others to check it out. The list of websites mentioning our film growing, and we would be honored if you would join the growing list distinguished sites below:
“The Boy Who Cried Warming” has enjoyed recommendations from:
Watts Up With That?
Examiner.com
Digging in the Clay
Bishop Hill
Junk Science
Climate Depot
No Trick Zone
Before it’s News
Climate Change Dispatch
Climate Ponderings
Jammie Wearing Fools
Oh What Now
SCEF.org.uk
Tom Nelson
And the list keeps on growing… PLEASE feel free to Google the name to check out the comments, and as always, enjoy the show!
Jesse Jones
Producer/Writer “The Boy Who Cried Warming”
Can you help me.
The IPCC says that a doubling of CO2 provides a forcing of 3.7w/m2 and likely temp. rise of 3C.
All the GHGs together added 2.64w/m2 i
n the year 2005 (4AR) which implies that temp. should be aprox. 2C higher today than we would expect from natural causes. Aerosols cant possibly explain the missing 2C, especially since Asian aerosol levels are at record
highs and asian temps. continue to rise.
If that 2.64w/m2 has only added aprox. 0.2C over the 20th century, as you say, shouldnt a doubling of CO2 only add aprox. 0.3C.
Is this a simple method of proving that
the IPCC forcasts are wrong by a factor of ten.
Nir
I apologise for the mangled sentences above.The couple of quotes below make me lean to the lower warming figure for a doubling of CO2.What do you think?
Douglas Hoyt ......"Thermal radiation from GHGs can only penetrate the top millemetre of the ocean.It cannot be the cause of the observed ocean warming.The ISCCP data shows that clouds have decreased where ocean warming is observed.It is the resulting increased solar radiation that is warming the oceans. .......at 15 microns (CO2) ,the implied water emissivity is 0.9998 implying that of the incident radiation only 0.02% of it will be absorbed.The emitted radiation will closely follow a blackbody emission curve where as the incident flux from CO2 is confined to a band centred at 15 microns.The implication of this is that much of the radiation emitted will escape to space through the IR windows,so it is a negative feedback.The initially absorbed energy cannot be transfered to the ocean depths by conduction (too slow),by convection (too small an absorption layer),or by radiation (too opaque).It must escape by the fastest way possible meaning upwards radiation away from the water."
Paul Linsay ......"...heating by conduction is very slow.Suppose the air temp. increases by 1C.Lets estimate its effect on the water temp..The thermal diffusivity of water is about 1.5e-7m^2/sec.After one year,3e7sec,the temp. will have risen by 1/3C at a depth of 2 metres and 1/9C at 4 metres.It would take 4 years for the temp. to rise by 1/3C at 4 metres.Compare this to the penetration depth of visible light which is roughly 10 metres.Visible light is able to deposit its energy over much greater depths of water.This would make increased sunlight a much better candidate for heating the ocean in depth than a simple rise in air temp.."
Does this mean that the IPCCs missing 2C in my previous question cannot be explained by energy storage in the oceans? Are rising ocean temps. explained more convincingly by cosmic ray flux affecting cloud cover in your opinion? The IPCC (4AR) say that 80% of the extra energy trapped by CO2 is stored in the oceans.Can they possibly be right?
Bob, I don't know specifics off of the top of my head (and there is more uncertainty than knowns for the warming beyond the ~1.2C for doubling CO2 equivalents), but I may be able to point you in the right direction.
1. For the recent decades, it has gotten about .6C or .7C warmer than the gerenarally accepted base period average. [Depending period looked at: Recent years have been more like .45C warmer. As I'm writing this, it's actually about the same or colder than the base period average.]
2. About half (slightly higher) of that is attributed to anthropogenic causes.
3. Direct effects of land use make up a small part of that (most notable, changes to albedo and water transport). [If I recall correctly, this accounts for about half of the direct anthropogenic warming component.]
4. A similar (possibly smaller) portion of that is attributed directly to GHGs.
5. The rest, and vast majority of the .35C or so of recent warming attributed to human activity, is generally said to be feedbacks, such as albedo decreasing and water vapor increases and ocean outgassing, resulting of the temperature being higher over time.
aaron
[As for the 80% trapped in the oceans, I'd say no. And it doesn't really matter (if 80% of the heat is going into the oceans, that's ~80% less of a potential problem. Essentially all their feedbacks would no longer apply, unless the laws of thermodynamics break down and nearly all of the heat ends up at the water surface surounding poles.)
As far as I know, oceans are warmed almost entirely by direct light. In order for the heat trapped by CO2 in the atmosphere to end up in the oceans, there would have to be a massive convective mechanism, it would need to radiate more downward than up, and air and water would need to have very high rates of conduction.
If it the were ending up in the oceans, the oceans would be warming (after correcting for observed changes in direct light reaching them and other know factors) and sea levels would rise faster from thermal expansion. I am not aware of any such thing being observed.]
Aaron, thanks for the reply.
If I understand you correctly, the only possible cause of significant thermal inertia in the oceans is for energy to enter the oceans by radiation and be released later to the atmosphere by conduction. This works fine for sunlight that has a wavelength that penetrates water to a depth of 10M but means that energy reemitted by CO2, which has a wavelength that does not penetrate water, has no significant temperature lags.
We should be seeing the CO2 induced increase in temperature right now as there should be little or no thermal inertia for the energy from this gas.
The point I was trying to make with my first post was that if all the GHG`s (CO2, methane, N2O, halocarbons) produced a forcing of 2.6w/m2 in 2005 (see Nir`s article Fig 2) and this produced a probable temperature rise of between 0.1C and 0.3C ,as observed over the last 100 years, then a doubling of CO2 which produces a forcing of 3.8w/m2 (see Nir`s article) should only increase the temperature 0.15C to 0.45C plus a bit since there is little or no thermal inertia for these gases.
If the 3.0C rise postulated by the IPCC for a doubling of CO2 (3.8w/m2) is used then the 1.3w/m2 forcing induced by all the GHG`s in 1975 should have increased the earth`s temperature by 1.0C at the end of a 30 year cold spell.This is clearly wrong. Additionly we should be 2.0C warmer now than we are.
The IPCC (chapter 9.6 AR4) make no distinction between CO2 induced radiation and solar radiation when calculating the thermal inertia of the oceans and, in fact, use historical examples (solar) to try to quantify these lags. They appear to have missed a major negative feedback as the radiation from the CO2 molecule is reflected mirrorlike from the oceans back to space mainly through the 10 micron area IR windows.
Any comments?
Pages