
On IPCCs exaggerated climate sensitivity and the emperor’s new clothes
Blog topic:
Normal science progresses through the collection of observations (or measurements), the conjecture of hypotheses, the making of predictions, and then through the usage of new observations, the modification of the hypotheses accordingly (either ruling them out, or improving them). In the global warming “science”, this is not the case.
What do I mean?
From the first IPCC report until the previous IPCC report, climate predictions for future temperature increase where based on a climate sensitivity of 1.5 to 4.5°C per CO2 doubling. This range, in fact, goes back to the 1979 Charney report published by the National Academy of Sciences. That is, after 33 years of climate research and many billions of dollars of research, the possible range of climate sensitivities is virtually the same! In the last (AR4) IPCC report the range was actually slightly narrowed down to 2 to 4.5°C increase per CO2 doubling (without any good reason if you ask me). In any case, this increase of the lower limit will only aggravate the point I make below, which is as follows.
Because the possible range of sensitivities has been virtually the same, it means that the predictions made in the first IPCC report in 1990 should still be valid. That is, according to the writers of all the IPCC reports, the temperature today should be within the range of predictions made 22 years ago. But they are not!
The business as usual predictions made in 1990, in the first IPCC report, are given in the following figure.
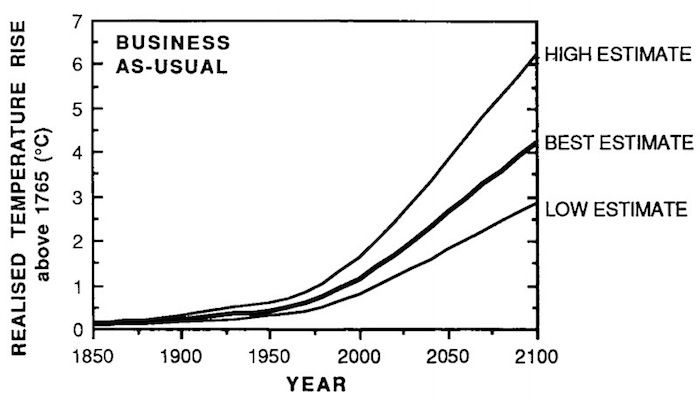
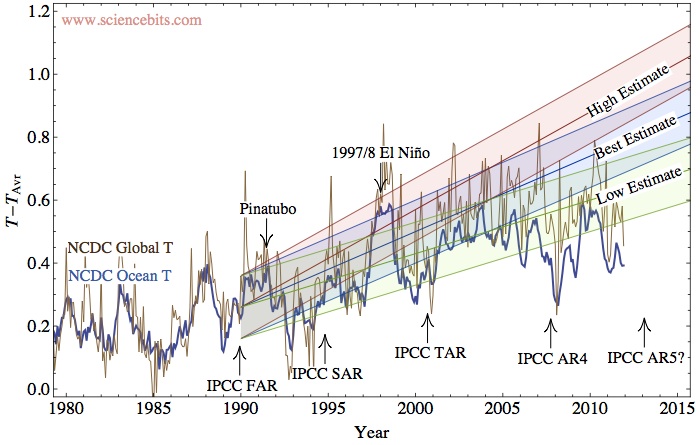
How well do these predictions agree with reality? In the next figure I plot the actual global and oceanic temperatures (as made by the NCDC). One can argue that either the ocean temperature or the global (ocean+land) temperature is better. The Ocean temperature includes smaller fluctuations than the land (and therefore less than the global temperature as well), however, if there is a change in the average global state, it should take longer for the oceans to react. On the other hand, the land temperature (and therefore the global temperature) is likely to include the urban heat island effect.
From the simulations that my student Shlomi Ziskin has carried out for the 20th century, I think that the rise in the ocean temperature should be only about 90% of the global temperature warming since the 1980's, i.e., the global temperature rise should be no more than about 0.02-0.03°C warmer than the oceanic warming (I'll write more about this work soon). As we can see from the graph, the difference is larger, around 0.1°C. It would be no surprise if this difference is due to the urban heat island effect. We know from McKitrick and Michaels' work, that there is a spatial correlation between the land warming and different socio-economic indices (i.e., places which developed more, had a higher temperature increase). This clearly indicates that the land data is tainted by some local anthropogenic effects and should therefore be considered cautiously. In fact, they claim that in order to remove the correlation, the land warming should be around 0.17°C per decade instead of 0.3. This implies that the global warming over 2.2 decades should be 0.085°C cooler, i.e., consistent with the difference!
In any case, irrespective of whether you favor the global data, or the oceanic data, it is clear the the temperature with its fluctuations is inconsistent with the "high estimate" in the IPCC-FAR (and it has been the case for a decade if you take the oceanic temperature, or half a decade, if you take the global temperature, not admitting that it is biased). In fact, it appears that only the low estimate can presently be consistent with the observations. Clearly then, earth's climate sensitivity should be revised down, and the upper range of sensitivities should be discarded and with it, the apocalyptic scenarios which they imply. For some reason, I doubt that the next AR5 report will consider this inconsistency, nor that they will revise down the climate sensitivity (and which is consistent with other empirical indicators of climate sensitivity). I am also curious when will the general public realize that the emperor has no clothes.
Of course, Andrew commented that the alarmists will always claim that there might be something else which has been cooling, and we will pay for our CO2 sevenfold later. The short answer is that “you can fool some of the people some of the time, but you cannot fool all of the people all of the time!” (or as it should be adapted here, “you cannot fool most of the people indefinitely!”).
The longer answer is that even climate alarmists realize that there is a problem, but they won’t admit it in public. In private, as the climategate e-mails have revealed, they know it is a problem. In October 2009, Kevin Trenberth wrote his colleagues:
The fact is that we can't account for the lack of warming at the moment and it is a travesty that we can't. The CERES data published in the August BAMS 09 supplement on 2008 shows there should be even more warming: but the data are surely wrong. Our observing system is inadequate.However, instead of reaching the reasonable conclusion that the theory should be modified, the data are "surely wrong". (This, btw, is a sign of a new religion, since no fact can disprove the basic tenets).
When you think of it, those climatologists are in a rather awkward position. If you exclude the denial option (apparent in the above quote), then the only way to explain the “travesty” is if you have a joker card, something which can provide warming, but which the models don’t take into account. It is a catch-22 for the modelers. If they admit that there is a joker, it disarms their claim that since one cannot explain the 20th century warming without the anthropogenic contribution, the warming is necessarily anthropogenic. If they do not admit that there is a joker, they must conclude (as described above) that the climate sensitivity must be low. But if it is low, one cannot explain the 20th century without a joker. A classic Yossarian dilemma.
This joker card is of course the large solar effects on climate.
Comments (52)
Hello Dr Shaviv
I became aware of your web site since meeting a young Palestinian scientist who was visiting Australia happened to walk into my business. We got to talking about AGW.
He spoke about the good work you did and suggested I visit your site, which I did and the rest is history.
I'm very sorry but I can't recall his name, it was a few years ago.
My request is this. Would you allow me to give this post a wider viewing by reposting it at Joanne Novas site. I love the simplicity of it.
p.s. I'm so glad Andrew took the time to visit you. I'm a regular of his highly popular blog. I'm sure having met him, you realise what a decent person he is.
regards
but it would be nice to add a link, so that those visitors can see more of my site ;-)
G'morning from Brisbane Dr Shaviv
Most certainly we would provide a link, not only to this article but particularly to one of my favourites, "Oceans as a Calorimetre".
I too have followed Andrew's blog, paper columns and TV programme.And am pleased to see hisname pop up on your excellent site. He is a careful thinker and extremely respectful of difference. Yet he has been pilloried and attacked for speaking plain considered thoughts. Sadly I do not expect any admission of fault or zealotry by the emporer or his friends no matter how undressed they are. They have dug themselves into too deep a hole
Dr. Shaviv,
I am curious if you also see AGW as part of the postmodern, consensus science movement that sacrificed the integrity of science and the basic rights of citizens in order to prevent the threat of mutual nuclear annihilation? http://omanuel.wordpress.com/about/
With kind regards,
Oliver K. Manuel
+1 Like
I have been making this point for some time. I am not disputing that there will be climate change just that the uncertainties don't permit us to say much about what that warming will ultimately be. If one looks at the response to co2 over the last 50 years when co2 should be at its most efficient in capturing energy we see a fairly muted response. Moreover, the "feedbacks" which are supposed to account for the vast majority of the ultimate change don't seem to be happening with near the magnitude the models or the theorists speculate. I use the word speculate carefully here because as you point out this is not the way science is normally done. Before we would have scientists running around saying they know this and that we would have had confirmatory experiments, serious data analysis that was repeated by other scientists. The biggest problems with the feedback analysis seems to be the complete lack of understanding and inability to predict cloud cover. The either complete lack of gain in specific humidity in the upper atmosphere. Also, as you point out the very unclear but too prominent to ignore relationship of sun, cosmic rays and sunspots to weather history and related effects. Because of these lack of correlations of real data with models it is clear something is seriously wrong. Humidity in particular represents an extremely thorny problem for the models. Its been going down not up. It is impossible to reach 2 degree sensitivity let alone 4 without additional humidity. So, the models appear grossly flawed. The science is extremely nascent with very little understood about the relationship of different forcings or feedbacks or their values. Without this knowledge it is impossible to make statements that we know temperatures will change one amount or another. The velocity of temperature change also seems to be greatly affected by ocean currents. The period from 1979 to 1999 which is touted as the time of warming was during a positive PDO/AMO phase. This phase has gone negative now and the temperatures have moderated. It isnt rocket science to conclude that this wavelike oscillation with a period somewhere around 50 years causes some of the exaggerated effect that scientists saw in the 1979-1999 period. If one factors that out then the rate of change halves. If one just averages the rate over a 50 year period to account for the cycle then one reaches 0.3C/50 years or about 0.6C/century not 2.4 or 4.5. There may ultimately be a higher feedback from co2 warming but it may take centuries, possibly 3 or 4 or more. There appears to be other cycles in the climate record on the order of 1000 years. We happen to be at the tail end of that cycle. If so, and weve been on the rising side of that then it would further reduce the sensitivity since some of that effect is contributing to the gain, not CO2. If we are on the falling end of that cycle then maybe the falling curve from there is masking the true sensitivity to Co2 we would see otherwise. There has been very important research on the effect of cosmic rays on clouds. If the effect is verified it would explain or help explain other aspects of weather. It would also reduce the sensitivity temperature to CO2. The facts are we dont know. The historical data we have is highly limited and not reliable for calculating these things to the desired accuracy. All we know for sure is that temperatures have been going up but we dont know if those temperatures are higher than at other times or what is affecting the temperature to what degree nor ultimately what all the feedbacks are or how much they will add or subtract from the ultimate warming. What we do see is that the sensitivity cant be huge because the data clearly arent supporting a high reaction to co2. The last 15.6 years have been statistically flat for temperatures. Sea levels are decellerating by several peer reviewed scientific papers. The argo buoy system which has been in opetation now for 10 years and for the first time giving us accurate ocean data shows no ocean temperature change at all practically for the entire 10 years it has been in operation. Sea levels are supposed to be climbing at much higher rates by the observed ice melt. However, they arent. This again points to what appears to be selective reporting of data. Ultimately whatever melting is occuring if it is not translating into sea level changes then obviously something else is pulling water out of the ocean or something else is happening which is mitigating the rise. All this points to a radical cadre of activists who keep trying to create fear and certainty where there is no cause for such concerns yet. There are numerous additional points I could make but it is clear that as you point out the sensitivity of the environment to co2 appears to be vastly less than was estimated in 1980 and the lack of public acknowledgement of that fact is clearly a political thing not science.
Dr. Shaviv -
I'd like to blog about this issue over at AEI, and would love to display your second graph, but I can't seem to copy it from your blog. Would you be able to send me a copy of it as a jpeg? My email address is Kgreen@aei.org.
Ken
cheers
nir
It might appear that the warmest "climate scientists" behave as they would about a religion, but it is more of a political agenda to which they have to be loyal. This is not scientists off on a dead-end of thinking. They are propagandists posing as scientists, handed money and the ability to push junk science on the public. WIthout the huge funding they receive, the "scientists" would never be funded with real grant funds.
AGW is all about creating a false crisis around something the world cannot stop using, carbon for energy. They create the myth that CO2 is bad and we are thus bad for needing to use it to power our lives. And, he who controls the world's energy, controls the world.
In short, CO2 has not downside, is a minor, if at all, factor in climate, is greeting the world and increasing our food supply. Coral reefs love it, ocean acidification is meaningless, and no organisms suffer from more CO2, as much as 10 times more!
This is all about a huge grab for power and wealth, Draconian wealth redistribution, crippling of the developed countries' economies, permanent stunting of undeveloped countries by converting them into nanny states with wealth transfers, and eventually creating a one-world government which would have to be totalitarian and socialist, which we know does not work. But, the people behind this agenda do not care that such a government would not work well for the people because they plan to be the power elite that lords over the world just as the USSR was socialism run by a gang, the Communist Party elite.
The only reason that the attempt to create a one-world power failed in Copenhagen a couple of years ago was that the UN read the agreement that was being pushed and they realized that they were being cut out of the power elite. So, they bailed and torpedoed the agreement. If they had been included, it might have been another story.
The UN was never set up to eventually become a government. It was set up to help keep peace in the world. But, they have aspirations way beyond their charter and it is time that we squash the UN and start over. They have developed the idea that they are in charge of the world. Instead, their job is really to handle complaints as countries bring them to the UN - nothing more.
It is ironic that the planet has been actively cooling since 2006 when Al Gore released his science fiction movie. With two ocean cycles both flipping to their 30 year cooling phase in 2006 and the Sun doing a possible Maunder Minimum 2.0 (the coldest of the LIttle Ice solar episodes), we have cooling to deal with for the next 30-40 years. Of course, the warmists will say, "yeah, and then warming will come back with a vengeance." Of course, when cooling stops, it is always followed b warming, duh! Otherwise it would be more cooling!
Climate never stays static and solar effects are real and cycles are real and ice ages are real and we are overdue for the next ice age. We simply need to do what we humans do best, PLAN and ADAPT.
About the only thing I would add is that gang of the communist elite that controlled Russia was controlled by the very same people who are pushing the one world government, financed both Hitler and Starlin during WWII, and who practically control the UN, and by defacto, most of us.
Dear Dr. Shaviv,
Thank you for your untiring efforts to expose the facts and therefore the falsehoods of the climate debate. The most exasperating aspect is the failure of the MSM to report items rejecting the barrage of PR and opinion pieces from the AGW flagwavers. It is only through blogs such as this and that of Andrew Bolt that the public have access to the counter consensus. As your graph so simply shows, the reality is far less frightening than the hyped projections and must cast significant doubt on,if not completely falsify, the AGW hypothesis. Being an oldish farmer I can honestly say that I have seen it all before.
Dr. Shaviv,
I realise it is easy to clutter a graph with too much information but an overlay of CO2 emissions over the same time frame would be even more damaging to the AGW cause.
The overlay of CO2 increases can form quite a good fit over the 20th Century, provided you look at the natural log of the CO2 level. I have been playing around with such a fit on a spreadsheet recently. For instance, using the HADCRUT data from 1945 to 2010 indicates that a doubling of CO2 leads to 1.6 to 2.0 degrees of warming.
However,
1) This assumes that CO2 has caused 100% of the underlying warming. Some would claim it is much greater than that (due to aerosols and ocean warming). Some (like Dr Shaviv) much less - It may be a spurious correlation, or there may be other factors.
2) Taking account of aerosols and ocean warming, the variability of possible outcomes makes any results meaningless. We simply do not have the data. Similarly with other GHGs, the impact of which the UNIPCC AR4 hypotheses are broadly neutralised by the aerosols.
3) The HADCRUT data has a warming bias as laid out in this posting. I would quite like to get hold of the NCDC data. Do you have a link, Dr Shaviv, to a site with dat or txt file?
1) I will soon write a post about how including the solar activity better fits the 20th century, implying that CO2 caused less than 100% of the warming. Stay tuned!
2) The fit also includes the possible range of aerosols. Because both the effects of the aerosols and CO2 are monotonically increasing (and opposite) then you are right that it is hard to put a finger on the exact value of the CO2. On the other hand, the solar effect on the climate is not monotonic. As a result, its contribution can be separated from the rest.
3) You can find the data at: ftp://ftp.ncdc.noaa.gov/pub/data/anomalies/
Cheers
Nir
An overlay would be nice, but the usual is the hockey stick merge of ice core with volcano data that is fraudulent - two such unrelated data sets cannot be merged, particularly as, in this case, they advanced the ice core data 83 years into the future to get them to merge.
However, it would be useful to go to Ernst Beck's 180 years of direct chemical CO2 bottle data and overlay a graph of his CO2 over the last 200 years. It shows quite nicely that CO2 has not been constant and low until just recently, but, just like everything else, it varies over time and has been much higher than now during three periods of the last 200 years, most recently in the 1940s during which temperature crashed, showing that CO2 cannot maintain, let alone cause, warming.
In any projection, you have two elements - the forcing scenario, and the model. You have blamed all discrepancies on the model, but you haven't looked at the forcings. Is what was assumed in 1990 for changes in forcings, close to what actually happened? Because if it isn't, your criticism of the model sensitivity would be misplaced.
Fred,
You mean to say "emission scenario" not "forcing scenario". The first was assumed and we've had pretty much business as usual. The second was - uh - modelled. Badly modelled certainly but close enough that we still should be over 0.1°C hotter than 10 years ago according to the IPCC.
We aren't.
No, I suspect that Fred meant exactly what he said. Forcings include aerosols. If DSW is lower than the modelled estimate, GAT will be lower than the modelled projection.
See:
Vernier et al. (2011) Major influence of tropical volcanic eruptions on the stratospheric aerosol layer during the last decade
GEOPHYSICAL RESEARCH LETTERS, VOL. 38, L12807, 8 PP., 2011
doi:10.1029/2011GL047563
http://www.agu.org/pubs/crossref/2011/2011GL047563.shtml
And:
Hansen & Sato (2011) Earth’s energy imbalance and implications
http://www.columbia.edu/~jeh1/.../20110826_EnergyImbalancePaper.pdf
You can see aerosol data from NASA's GISS here:
http://data.giss.nasa.gov/modelforce/strataer/tau_line.txt
Plot it for yourself. Aerosols are at a 50 year low right now so that can't be it despite Hansen's laughable excuses.
FergalR
Those are the data used to force GISS modelE. They are out of date estimates, which is exactly my original point. Look at Vernier et al. (2011) for an up-to-date perspective. And try and keep an open (and civil) mind. 'Laughable excuses' etc is unnecessary.
It's simply not enough to have cancelled out the fantasised warming. Vernier's analysis agrees with earlier ones. Check the *logarithmic* scale on his figure 5 and compare the puny recent blip to towering Pinatubo; a repeat of which would have been required to counter IPCCesque accelerating warming.
Serial arrestee Hansen and his crackpot doomsday prophecies are laughable. Anyone with an open mind can see that. If a few disillusioned cultists fancy watching him play Ptolemaic epicycles with aerosols then that's even funnier. Cheers.
FergalR
Apologies - I haven't been keeping an eye on this thread.
Elsewhere you have argued that:
- the aerosol loading described in Vernier et al. (2011) is climatologically insignificant
- the 1991 Mt Pinatubo eruption cooled GAT by 0.2C
You did not explain how you determined that the aerosol loading observed by Vernier was climatologically insignificant. This is not the conclusion reached by Solomon et al. (2011) (Vernier is a co-author):
Also, I was under the impression that Pinatubo is generally credited with lowering GAT by about 0.8C (remember that the 1991-1992 El Nino would normally have raised GAT by 0.2C).
However I may be mistaken. Since the 0.2C estimate is generally accepted it must be widely supported, so you will have no trouble in providing several references for it.
Solomon et al. (2011) abstract:
http://www.sciencemag.org/content/333/6044/866.abstract
Typo above; apologies:
- the aerosol loading described in Vernier et al. (2011) is climatologically INsignificant
BBD,
Elsewhere I have demonstrated to you that you can't even read a graph.
Here is GISS's data versus Vernier's. Again:
http://i41.tinypic.com/2iuavmb.jpg
The averages for the last decade are almost identical. But Vernier's numbers for higher latitudes are 40% lower than the equatorial numbers displayed above. So the GISS model - if not all of them - over-account for aerosols. I'm curious to know what Solomon was thinking when she wrote about models neglecting it. (N.B. also how short Pinatubo's effect was compared to what GISS thought).
Solomon's claimed -0.1 W/m^2 is Hansen-style wiggle-matching guesswork. But if she is correct and you're right about that counteracting AGW then the IPCC's imagined 0.4 W/m^2 increase in anthropogenic forcing this decade is 4 times too high. Congratulations, BBD, the world will be less than 1°C warmer by the end of the century. Volcanic aerosols and man-made greenhouse gases are equally insignificant. Catastrophe averted. All thanks to you.
The 0.8°C cooling from Pinatubo you speak of during 1992 is absolutely fascinating. It would mean there's been no man-made global warming for 19 years. Tell me more.
Dig up.
I thought you might have a bit of trouble with references for your claimed 0.2C cooling from Pinatubo.
Your home-made digitised graph is not an accurate reproduction of Vernier's figure. We have established that elsewhere.
All in all, much aggressive bluster, many errors, and very little substance.
You deliberately misrepresent what I said, which is a reliable indicator of bad faith:
As we both know perfectly well, the cooling lasted for ~2 years. What with your unpleasant tone here and elsewhere, your home-made graph, your grossly understated figure for Pinatubo cooling and your refusal to admit that error, I do not think you are interested in pursuing a constructive discussion.
Confirming the accuracy of my graph and adding 0.8°C to the post-Pinatubo temperatures would be simple tasks for all but the blind or profoundly stupid. This would be a constructive discussion if you could admit your limited intellect. It'd save you from wasting everybody's time.
Very nice, simple and clear, thank you.
One minor problem though: when I tried to access the linked document (charney_report.pdf), a "Page not found" error was returned...
You can read Charney et al. (1979) online without having to download the entire report.
See here:
http://www.nap.edu/catalog.php?record_id=12181#toc
Pages