
The fine art of fitting elephants
A few weeks ago, while debating the issue of global warming with an alarmist (who thinks melting Greenland within 100 years is a reasonable possibility), my colleague pointed out two facts which appear to be consistent with the "standard" anthropogenic scenario, but not the one I advocate, that the natural climate drivers are large and that Earth's climate sensitivity is small.
First, he noted that climatologists can nicely fit the temperature increase over the 20th century with their usual suspects: Anthropogenic drivers as well as the mundane natural forcings (solar irradiance and volcanic aerosols). Second, he pointed out that climatologists do a good job in fitting the observed climatic response to Pinatubo and other volcanoes, such that the climate models cannot be significantly off in their sensitivity, as I believe is the case (for good reasons).
Although I knew for quite a while why the first point is meaningless, I must confess that I was a little bothered with the second point. Alas, it was in vain. It turns out that both points raised are fine exemplars for how IPCC science is plain bad.
20th century warming
The first point raised is rather simple to address. The fact that GCMs can fit the temperature increase is totally meaningless. Why? Because the allowed parameter space is so large climatologists could fit anything from a small temperature decrease (as was claimed in the 70's, before the imminent ice-age) to double or triple the observed 20th century increase. This means that a good fit cannot be used to significantly strengthen the claim that the anthropogenic theory is necessarily correct, as is often claimed. This is especially the case when considering that there is another climate driver which increased over the 20th century.
Specifically, the total temperature increase over the 20th century can be predicted to be the net radiative forcing times the climate sensitivity times the finite response efficiency over the several decade time scale (because it takes time to reach the equilibrium response, that is, we don't see all the change associated with the forcings radiation imbalance unless we wait long enough).
According to the latest IPCC report, the first number is $1.6^{+0.8}_{-1.0}$ W/m2, assuming you believe their error estimate on the aerosols. The second number is (again, according to the IPCC AR4, not the real value which is lower), 2 to 4.5°C for CO2 doubling, i.e, a sensitivity of (2-4.5°C) / (3.8 W/m2). The last number is probably around 50% (e.g., from this paper by Schlesinger Andronova and Kolstad).
If you multiply the three numbers (and add the errors in quadrature, assuming the errors are independent), you find that a priori, without observations to compare with, climatologists should have predicted a human induced warming of about 0.7±0.5°C. Fig. 1 reveals the meaning of this number, and why fitting the observed warming is totally meaningless. Any monotonic, or a nearly monotonic temperature behavior could have been fitted equally well.
A quote attributed John von Neumann (at least so it was told by Enrico Fermi to Freeman Dyson) sums up the first part of the story: “Give me four parameters, and I can fit an elephant. Give me five, and I can wiggle its trunk".”
Here the elephant is very simple (an almost monotonically increasing function), so with just two parameters (the climate sensitivity and the total aerosol forcing), it is easy to fit this elephant. Nonetheless, given that there are only 2 parameters, it is not surprising that the fit is not so great when looking at the fine details. In fact, it has distinct clues which tell us that the sensitivity is lower than the range advocated by the IPCC. I'll get to that later below.
Pinatubo?
I must admit that at first glance, the paper pointed out by my alarmist colleague looked convincing, which made me quite puzzled. After looking at their data, and then at the whole data, I realized that the authors simply went astray.
The paper I'm talking about is Soden et al. 2002. If their result is to be summed up by one graph, it is that in fig. 2. As you can see, there is no room for a low sensitivity climate because their high sensitivity GCM nicely fits the observed temperature decrease. Or does it?
The whole MSU data, which Soden et al. used, appears in fig. 3. Can you spot in the figure the distinctive decrease in the temperature? That is to say, can you point to Pinatubo's temperature decrease without looking at the years? Clearly, the MSU temperature data has many variations of almost ±0.2°C. The only exception is the 1997/8 el Niño.
If you couldn't spot see the "distinctive" temperature decrease following Pinatubo, let me help you. Fig. 4 has the MSU data of fig. 3, together with Soden's et al. figure placed on it. Doesn't it look strange?? The baseline temperature that the authors took is 0.2°C higher than the real average temperature over the relevant period. If the baseline was really where Soden et al. assumed it is, then the similar 0.3-0.4°C drops in 1981, 1983, 1988, 1996 and 2004 should too be attributable to similar decreases in the radiative balance. Of course, this is not the case. These drops are simply variations which arise without large external variations to the energy budget, they are part of the internal climate variations. (Note that the large drop in 1981 took place a few months before El Chichón's eruption).
Given that the temperature in the year following the eruption was 0.2 deg below the few year average preceding it, and given that the natural fluctuations are about ±0.2°C, all that can be said is that Pinatubo caused a 0.2±0.2°C cooling. Drawing the graph in figure 2 is simply misleading (to say the least).
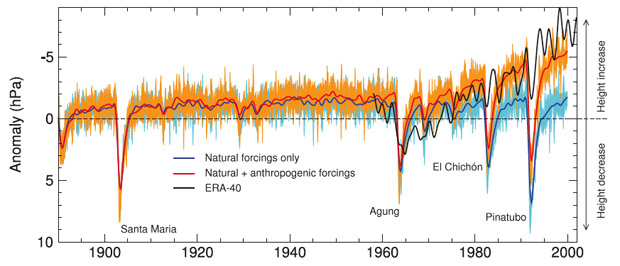
Moreover, if you open the IPCC-AR4 report, you'll be able to find the graph depicted here as fig. 5. It compares reanalysis data for the tropospheric height to model results. Here the fluctuations are relatively smaller, and one can clearly see that the GCM response to Pinatubo and El Chichón is much larger than the real response. Clearly, Global Climate Models over estimate the climate sensitivity.
What about other volcanoes?
Well, if you look again at fig. 1 (shown again as fig.6 with my pointers), you'll see that there are consistently large discrepancies between the observed temperature and the fitted one using GCMs. For example, when GCMs are used to best fit the 20th century warming, they give a global temperature drop of about 0.4-0.5°C during the great eruption of Krakatoa. In real life, the eruption barely tickled the climate system, with a response not larger than 0.1-0.2°C. The story repeats itself with Agung's eruption in 1963 and el Chichon in 1982. If you look at the real temperature, you could not have guessed that there were any volcanic eruptions. It is only when one looks at the average of 6 major volcanic eruptions that one can discern a temperature decrease, as is apparent in fig. 7.
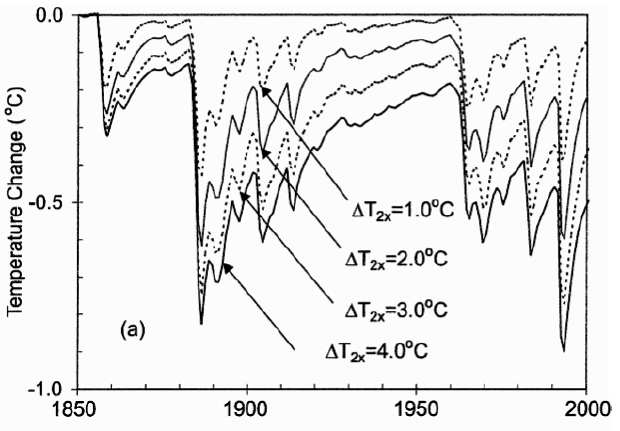
 The requirement of a small climate sensitivity is apparent also in fig. 8, which summarizes the results of a global energy budget model having different climate sensitivities. From the figure, it is apparent that climate sensitivities of ΔTx2 ~ 1°C or less are required to explain the meagre temperature decreases following the major volcanic eruptions. A sensitivity of ΔTx2 ~ 3°C or anything more is simply out of the question.
Incidentally, I am certainly not the first to note that volcanoes barely tickle the Earth's climate system, thus implying that Earth's climate sensitivity has to be on the low side. Prof. Richard Lindzen of MIT has pointed it out already quite some time ago, as did others.
To conclude, GCMs cannot properly fit the observed 20th temperature increase. Even if one uses the large leeway allowed because of the uncertainty in the sensitivity and the effects of the aerosols, the fact that volcanic eruptions stand out as inconsistencies in the fit is a vivid clue that climate sensitivity is much lower than the range advocated by the IPCC.
References
First, he noted that climatologists can nicely fit the temperature increase over the 20th century with their usual suspects: Anthropogenic drivers as well as the mundane natural forcings (solar irradiance and volcanic aerosols). Second, he pointed out that climatologists do a good job in fitting the observed climatic response to Pinatubo and other volcanoes, such that the climate models cannot be significantly off in their sensitivity, as I believe is the case (for good reasons).
Although I knew for quite a while why the first point is meaningless, I must confess that I was a little bothered with the second point. Alas, it was in vain. It turns out that both points raised are fine exemplars for how IPCC science is plain bad.
20th century warming
The first point raised is rather simple to address. The fact that GCMs can fit the temperature increase is totally meaningless. Why? Because the allowed parameter space is so large climatologists could fit anything from a small temperature decrease (as was claimed in the 70's, before the imminent ice-age) to double or triple the observed 20th century increase. This means that a good fit cannot be used to significantly strengthen the claim that the anthropogenic theory is necessarily correct, as is often claimed. This is especially the case when considering that there is another climate driver which increased over the 20th century.
Specifically, the total temperature increase over the 20th century can be predicted to be the net radiative forcing times the climate sensitivity times the finite response efficiency over the several decade time scale (because it takes time to reach the equilibrium response, that is, we don't see all the change associated with the forcings radiation imbalance unless we wait long enough).
According to the latest IPCC report, the first number is $1.6^{+0.8}_{-1.0}$ W/m2, assuming you believe their error estimate on the aerosols. The second number is (again, according to the IPCC AR4, not the real value which is lower), 2 to 4.5°C for CO2 doubling, i.e, a sensitivity of (2-4.5°C) / (3.8 W/m2). The last number is probably around 50% (e.g., from this paper by Schlesinger Andronova and Kolstad).
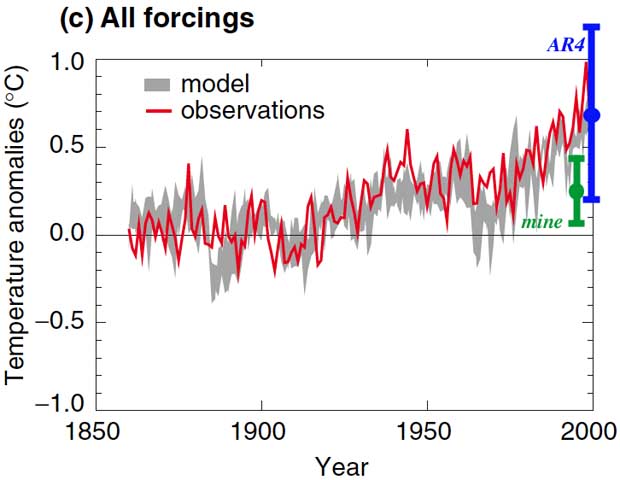
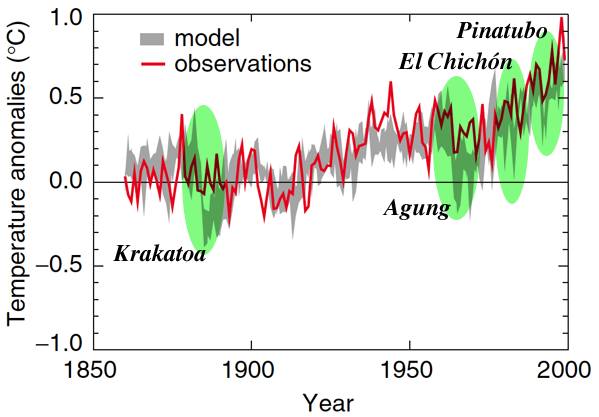
If you multiply the three numbers (and add the errors in quadrature, assuming the errors are independent), you find that a priori, without observations to compare with, climatologists should have predicted a human induced warming of about 0.7±0.5°C. Fig. 1 reveals the meaning of this number, and why fitting the observed warming is totally meaningless. Any monotonic, or a nearly monotonic temperature behavior could have been fitted equally well.
Figure 1: Models can fit 20th century warming. This is seen is this graph taken from the IPCC-TAR where the gray region depicts different model results and the red line the actual surface temperature measurements (there is a similar IPCC AR4 graph, but it commences in 1900, thus covering up a clear embarrassment for high sensitivity models, as I describe below).
The blue error bar is the estimate for how much warming one would guess using AR4 values for the net radiative forcing and the climate sensitivity. Clearly, almost any observed warming, from 0.2 to 1.2°C, would have been comfortably explainable as anthropogenic warming. Thus, the "fit" bares no real significance on the validity of the anthropogenic assumption. The green error bar is the estimate I find using the IPCC AR4 net radiative forcing but with my best estimate for the climate sensitivity (ΔTx2 = 1 to 1.5°C), based on how earth actually behaved, as opposed to how it behaves in numerical simulations. The green error bar cannot explain the whole warming because the IPCC AR4 is missing a large natural radiative forcing, that associated with the solar → cosmic ray → link.
A quote attributed John von Neumann (at least so it was told by Enrico Fermi to Freeman Dyson) sums up the first part of the story: “Give me four parameters, and I can fit an elephant. Give me five, and I can wiggle its trunk".”
Here the elephant is very simple (an almost monotonically increasing function), so with just two parameters (the climate sensitivity and the total aerosol forcing), it is easy to fit this elephant. Nonetheless, given that there are only 2 parameters, it is not surprising that the fit is not so great when looking at the fine details. In fact, it has distinct clues which tell us that the sensitivity is lower than the range advocated by the IPCC. I'll get to that later below.
Pinatubo?
I must admit that at first glance, the paper pointed out by my alarmist colleague looked convincing, which made me quite puzzled. After looking at their data, and then at the whole data, I realized that the authors simply went astray.
The paper I'm talking about is Soden et al. 2002. If their result is to be summed up by one graph, it is that in fig. 2. As you can see, there is no room for a low sensitivity climate because their high sensitivity GCM nicely fits the observed temperature decrease. Or does it?
Figure 2: Soden et al. temperature fit. Quite vividly, the GCM obtained temperature decrease appears to fit the observed tropospheric temperature (MSU) decrease after Mt. Pinatubo's eruption.
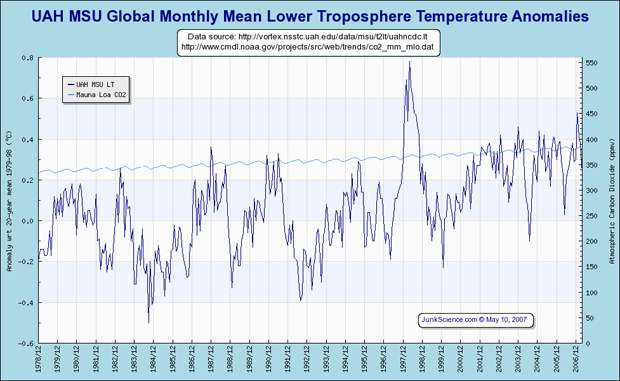
The whole MSU data, which Soden et al. used, appears in fig. 3. Can you spot in the figure the distinctive decrease in the temperature? That is to say, can you point to Pinatubo's temperature decrease without looking at the years? Clearly, the MSU temperature data has many variations of almost ±0.2°C. The only exception is the 1997/8 el Niño.
Figure 3: The MSU lower troposphere data taken from junkscience.com. Besides 1997's el Niño, there are many variations of order ±0.2°C.
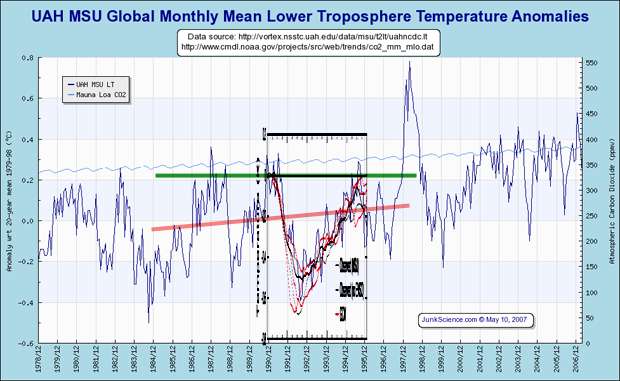
If you couldn't spot see the "distinctive" temperature decrease following Pinatubo, let me help you. Fig. 4 has the MSU data of fig. 3, together with Soden's et al. figure placed on it. Doesn't it look strange?? The baseline temperature that the authors took is 0.2°C higher than the real average temperature over the relevant period. If the baseline was really where Soden et al. assumed it is, then the similar 0.3-0.4°C drops in 1981, 1983, 1988, 1996 and 2004 should too be attributable to similar decreases in the radiative balance. Of course, this is not the case. These drops are simply variations which arise without large external variations to the energy budget, they are part of the internal climate variations. (Note that the large drop in 1981 took place a few months before El Chichón's eruption).
Given that the temperature in the year following the eruption was 0.2 deg below the few year average preceding it, and given that the natural fluctuations are about ±0.2°C, all that can be said is that Pinatubo caused a 0.2±0.2°C cooling. Drawing the graph in figure 2 is simply misleading (to say the least).
Figure 4: MSU data with the Soden et al. graph overlaid on it. One can clearly see that they took a baseline temperature which is 0.2°C higher than the real average. Taking a realistic baseline, the Pinatubo cooling is only 0.2±0.2°C. The smaller cooling implies a lower climatic sensitivity.
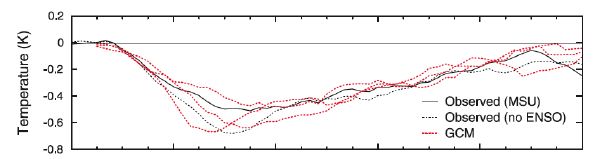
Moreover, if you open the IPCC-AR4 report, you'll be able to find the graph depicted here as fig. 5. It compares reanalysis data for the tropospheric height to model results. Here the fluctuations are relatively smaller, and one can clearly see that the GCM response to Pinatubo and El Chichón is much larger than the real response. Clearly, Global Climate Models over estimate the climate sensitivity.
Figure 5: The Modeled and observed tropospheric height, from the IPCC-AR4 report. The blue and red lines are results of numerical simulations while the black is observations (through the reanalysis data). One can clearly see that the model predictions for the decreases following El Chichón and Pinatubo are much larger than those observed. Over Agung, there is a large observed drop, but it is not nearly as sharp as the predictions, hinting that the decrease may very well be unrelated to the volcanic eruption.
What about other volcanoes?
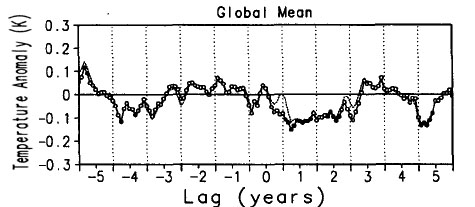
Well, if you look again at fig. 1 (shown again as fig.6 with my pointers), you'll see that there are consistently large discrepancies between the observed temperature and the fitted one using GCMs. For example, when GCMs are used to best fit the 20th century warming, they give a global temperature drop of about 0.4-0.5°C during the great eruption of Krakatoa. In real life, the eruption barely tickled the climate system, with a response not larger than 0.1-0.2°C. The story repeats itself with Agung's eruption in 1963 and el Chichon in 1982. If you look at the real temperature, you could not have guessed that there were any volcanic eruptions. It is only when one looks at the average of 6 major volcanic eruptions that one can discern a temperature decrease, as is apparent in fig. 7.
Figure 6: fig. 1 redrawn with pointers to the major volcanic eruptions (models in gray, observed surface temperature in red). Evidently, global circulation models predict temperature decreases which are much larger than those observed. Why? Because GCM climate sensitivity is too large.
Figure 7: The globally averaged surface temperature in the few years preceding and following a major volcanic eruption, taken from Robock and Mau (1995). The volcanos are Krakatau, Santa Maria, Katmai, Agung, el Chichon and Pinatubo. Apparently, the global temperature decrease following these major eruptions is very modest, just over 0.1°C, and barely overcoming the natural climate variations.
Figure 8: Harvey and Kaufmann used a global energy budget model with a variable climate sensitivity to assess which sensitivity best fits the observed temperature decrease following major volcanic eruptions. As can be seen from their graph, IPCC type climate sensitivities of ΔTx2 ~ 2°C to 4°C give unrealistically high temperature decreases. For example, ΔTx2 ~ 3°C gives a typical 0.5°C decrease following Krakatau's eruption. This is consistent with the typical GCM results portrayed in fig. 6, but much larger than the actual global temperature response (seen in fig. 7).
Incidentally, I am certainly not the first to note that volcanoes barely tickle the Earth's climate system, thus implying that Earth's climate sensitivity has to be on the low side. Prof. Richard Lindzen of MIT has pointed it out already quite some time ago, as did others.
To conclude, GCMs cannot properly fit the observed 20th temperature increase. Even if one uses the large leeway allowed because of the uncertainty in the sensitivity and the effects of the aerosols, the fact that volcanic eruptions stand out as inconsistencies in the fit is a vivid clue that climate sensitivity is much lower than the range advocated by the IPCC.
References
- Soden, Brian J., Richard T. Wetherald, Georgiy L. Stenchikov, and Alan Robock, 2002: Global cooling following the eruption of Mt. Pinatubo: A test of climate feedback by water vapor. Science, 296, 727-730 - These guys show that the observed MSU temperature decline following pinatubo can be fitted using a typical GCM (in their case, based on GFDL as is described in their supplementary materials). Of course, they do so by choosing an unrealistically high baseline.
- Robock, Alan and Jianping Mao, 1995: The volcanic signal in surface temperature observations. J. Climate, 8, 1086-1103 - This paper looks at the average surface temperature decrease following volcanic eruptions, They nicely demonstrate that it is typically 0.1-0.2°C during the 6 largest eruptions since and including Krakatau.
- IPCC-TAR (2001), IPCC-AR4 (2007): Here you can find meaningless fits of global circulation models to 20th century warming, which show that the warming can be explained using typical GCMs with anthropogenic+modest natural forcings.
- L. D. Danny Harvey and Robert K. Kaufmann, J. of Climate, 15, 2837-2861, 2002: Simultaneously Constraining Climate Sensitivity and Aerosol Radiative Forcing. This couple uses an energy balance model to show how different climate sensitivities can explain 20th century warming and the temperature reduction following volcanic eruptions. The authors find that the volcanic response requires a low climate sensitivity, while 20th century warming a higher one. Of course, the last point is because they use an anemic natural forcing, and not the large real one due to the apparent cosmic ray flux climate link.
- Richard Lindzen, and C. Giannitsis, 1998: On the climatic implications of volcanic cooling. J. Geophys. Res., 103, 5929–5941. Richard Lindzen of course advocates for a very low climate sensitivity. He points out that not only is the real temperature reduction smaller than that obtained from large sensitivity models, but that the duration of the effect becomes too long if the sensitivity is too high.
Comments (18)
Did you attempt to estimate the significance of Figure 7?
That is, given 6 random time offsets into the temperature record (rather than the 6 offsets determined by the volcanic eruptions), what is the probability of a -0.1C drop in the average of the six thus-determined temperature series showing up at lag = 1 year?
Just by eyeball from Figure 4, it appears that 0.2C excursions year-by-year are common. 0.2C / sqrt(6) = 0.08C. It seems that even the statistics of the effect of the volcanic data are not that significant... Or?
Yep, the temperature drops following volcanic eruptions are not really significant...
Just a point of caution, some of the figures are MSU (i.e., tropospheric data) and some are surface data. I think the latter has somewhat smaller variations.
-- Nir
Thanks for the warning. I missed that.
Interesting sequence and explanation, thank you Nir.
I recall around the time of Pinatubo searching for the Krakatoa signal in station temperature data and being surprised that little stood out.
It appears Solanki et al at Max Planck are unwaivering in their analysis of the sun having a minimal effect on global warming the last 30 years. They state most of the warming is a result of increased CO2 levels during this period and the sun's role is minimal.
AGW proponents continually cite Solanki as being the final nail in the coffin for "denialists".
What is your response to that and are there areas in solar physics still not yet understood such as CME's etc. which could account for this observation?
Do you think the STEREO and Hinode projects will shed more light on how the sun affects climate?
Additionally, rasmus et al at RealClimate posted a scathing attack on Svensmark's work on the SKY experiment and the whole subject of cosmic rays. Any comment?
Thanks.
I wish I had more time to answer it properly, nevertheless, here are a few short answers to your questions.
First, Solanki. Solanki and his colleagues are doing fine work in quantifying the total solar irradiance (TSI). What they find is that the variations in the TSI from solar cycle to solar cycle are very small. Thus, TSI variations cannot account for any meaningful fraction of the long term climate change. However, just citing this fact, that TSI variations cannot explain the recent climate change doesn't imply that solar activity is not import, since there may be other avenues through which it could affect climate, other than variations the TSI.
One such avenue is the cosmic ray flux, which, as you mention, is being attacked by AGW proponents such as Rasmus on RealClimate. Since the arguments for global warming are basically the lack of evidence for anything else (there is no fingerprint proving that the warming is from CO2 for example), the strength of their case (and funding) depends on the cosmic ray flux climate link being wrong. Anyway, I have yet to have seen an argument that would make be doubt the CRF/climate link. On the other hand, there are many published results which point to the existence of this link. Svensmark's Sky experiment is just one of them.
Any experiment which will help us understand the variations in the solar activity will of course help, in particular considering that there are many open questions about the non-thermal components of the sun.
Sorry, I know this is off topic but I'm having trouble printing your blog entries (& other pages) using either IE or Firefox on Windows. On IE I get several pages with just headers and footers; on Firefox I get a page or so of text. I get the same result whether or not I print background images & colors. Just thought you might like to know in case I'm not the only one...
thanks for pointing it out. It appears that there are also problems with firefox on OS X, but safari prints it well... anyway, I am about to upgrade the website to a newer version of the content manager system I am using, and face lift the theme as well. Hopefully firefox will be able to handle the new theme.
Perhaps one way to illustrate this effect would be to run the models to fit other curves... perhaps one could parameterize the models to fit hemline length, political party in office, or whatever. How hard would it be to set up and run an independent version of this?
It depends on the level of details you wish to fit... but in any case, it would be just an anecdotal result. Incidentally, the temperature was already empirically fitted to solar activity variations. In fact, it was shown that it can better explain the observed global warming (that is, explain a larger fraction of it) than just anthropogenic gases alone.
I was just wondering, you say that a doubling of CO2 will cause a 1C warming, how much would the Earth warm from a quadrupling of CO2?
It would be just 2 degrees since there are two doublings. Similarly, there would be 3 degrees for a factor of 8 increase, 4 degrees for a factor of 16 increase. For perspective, the atmospheric concentration of CO2 was 0.028 percent in 1880 and is not expected to double from that level until 2100, at the current rate of fossil fuel usage.
Wrong. CO2 impact on Temperature is not linear, but logarithmic. It means that level of greenhouse forcing for every additional molecule of CO2 is smaller that forcing of previous one. Because of that we experienced already 3/4 of greenhouse effect of doubling CO2 concentration, although concentration increased from 280 ppmv to 380 ppmv now, what is only 40% of the way we have to go from preindustrial times until doubling of CO2.
So, temperature increase from quadrupling of CO2 concentration will not be 2 C, but say 1,3 or 1,4 degrees C.
... and so are you. What frost was describing is logarithmic increase. Indeed, if climate sensitivity to CO2 doubling is logarithmic and doubling gives rise to a °C increase (roughly the number I get), then a x4 increase implies a 2°C increase. Note that the increase is not exactlylogarithmic, but the deviations become important for really large CO2 increases.
As for your comment that we have already experienced 3/4s of the greenhouse effect, this is correct in terms of radiative forcing, but not necessarily in terms of temperature. This is because of two effects:
- It takes time for the climate system to reach equilibrium, implying that we are still not seeing the full effect of the anthropogenic radiative imbalance.
- The temperature increase is masked by a temperature decrease due to aerosols, which are assumed not to increase until the 21st century, as the CO2 does.
Nir
Hi, I am a little bit confused on your fitting of figure 2 to figure 3 to obtain figure 4. You appear to have copied and pasted their figure and made it look like a discrepancy, for e.g. their lowest point being 0.6, and in the MSU data it is 0.4. Yet in the Soden paper, they clearly point out that in their analysis the linear trends are removed. This is common procedure in any data analysis. That there are a number of other variations which appear to dwarf volcanic effects on longer time scales isn't the point. They are determining the transient response of the climate with respect to a defined point over a comparitively short window, during which that event is the dominating factor. It would have been more evident if you also included their figure 4, where you can clearly see the effects of water vapour in their models compared to MSU data. If they are fitting elephants by adopting their vapour-feedback model, then lack of water-vapour feedback in the modelling would be akin to fitting whales. BTW I'm not a proponent or opponent of AGW, I just want to see a more careful analysis of the facts.
First, my "fitting of figure 2 to figure 3 to obtain figure 4", is basically what Soden et al. did. I just replicated their analysis. Only unlike them, I also showed how the temperature varied longer before and after the event.
Second, the point about the 0.4 vs 0.6°C being the lowest point is meaningless. This is the absolute temperature anomaly normalization which is simply different between Soden et al., and the MSU graph from junkscience.com).
Third, it is excellent that Soden et al. take out the linear trends. I have no problem with that. I have however a problem with the fact that their "comparatively short window" which you mention starts exactly before the pinatubo eruption, in a period which would otherwise appear like a positive temperature fluctuation of Earth, as is the case with the end period of this comparatively short window.
Because there is so much "climatic noise" at the relevant scales, it is simply impossible to fit the response of a single volcano as it drowns in noise. It only starts to become meaningful if you average out several large volcanic eruptions, as Robock & Mao did. Once you do so, you realize that either Pinatubo is totally unique... or more likely, that it sits on large temperature fluctuations.
In connection with figure 5 you argue that the change in tropospheric height following a volcanic eruption shows that IPCCs GCMs are to sensitive. This layman has a bit of a problem to follow the logic here. How is tropospheric height related to temperature changes? The rest of the arguments in the article is pretty convincing so you might want to explain this part as well. Thank you,
best regards
The height of the troposphere is determined from the equilibrium between the tropospheric heating (e.g., sunlight, CO2) and cooling (e.g., volcanic aerosols), and stratospheric heating (e.g., ozone). The relation is not trivial, but that's besides the point.
All I wanted to show is a climate variable for which there are clear predictions for its behavior (based on numerical models), yet reality is clearly inconsistent with those predictions.